

Overview
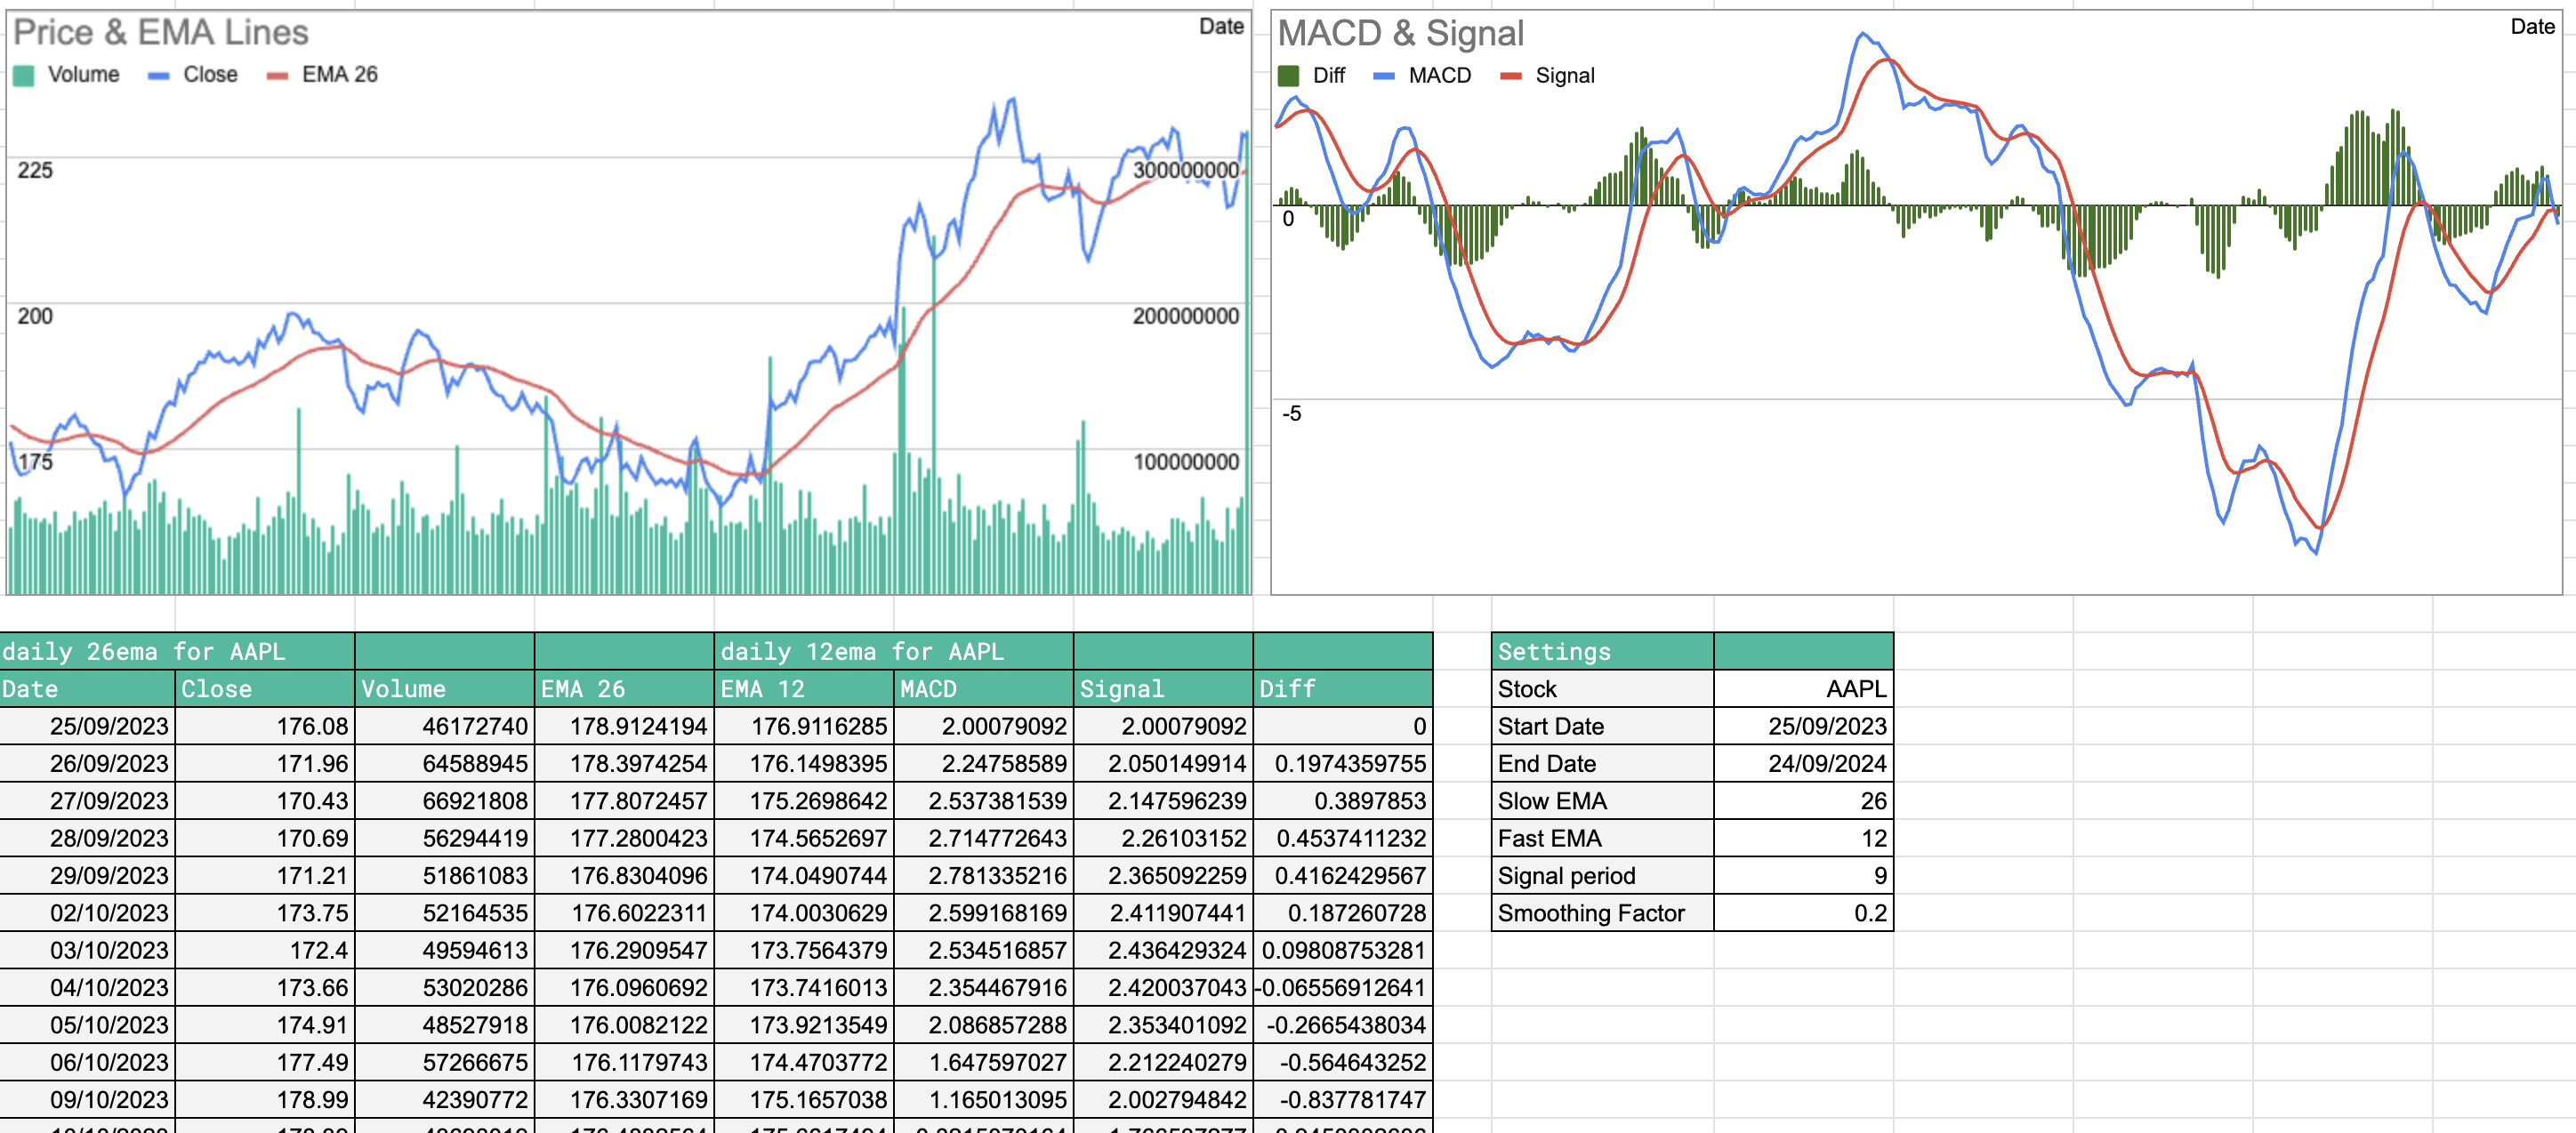
This template is a good introduction to SheetsFinance Technical Analysis. By altering the settings in cells J18:K25 you can generate two different Exponential Moving Averages (EMAs) and then construct the resultant MACD line. Two charts display the resulting data, a price & EMA chart and a MACD chart. The charts will reload whenever a new stock symbol or new metrics are entered into the settings.
Functions used
The SheetsFinance functions this template is built with. Read the docs to adapt it.