

SF DuPont Analysis
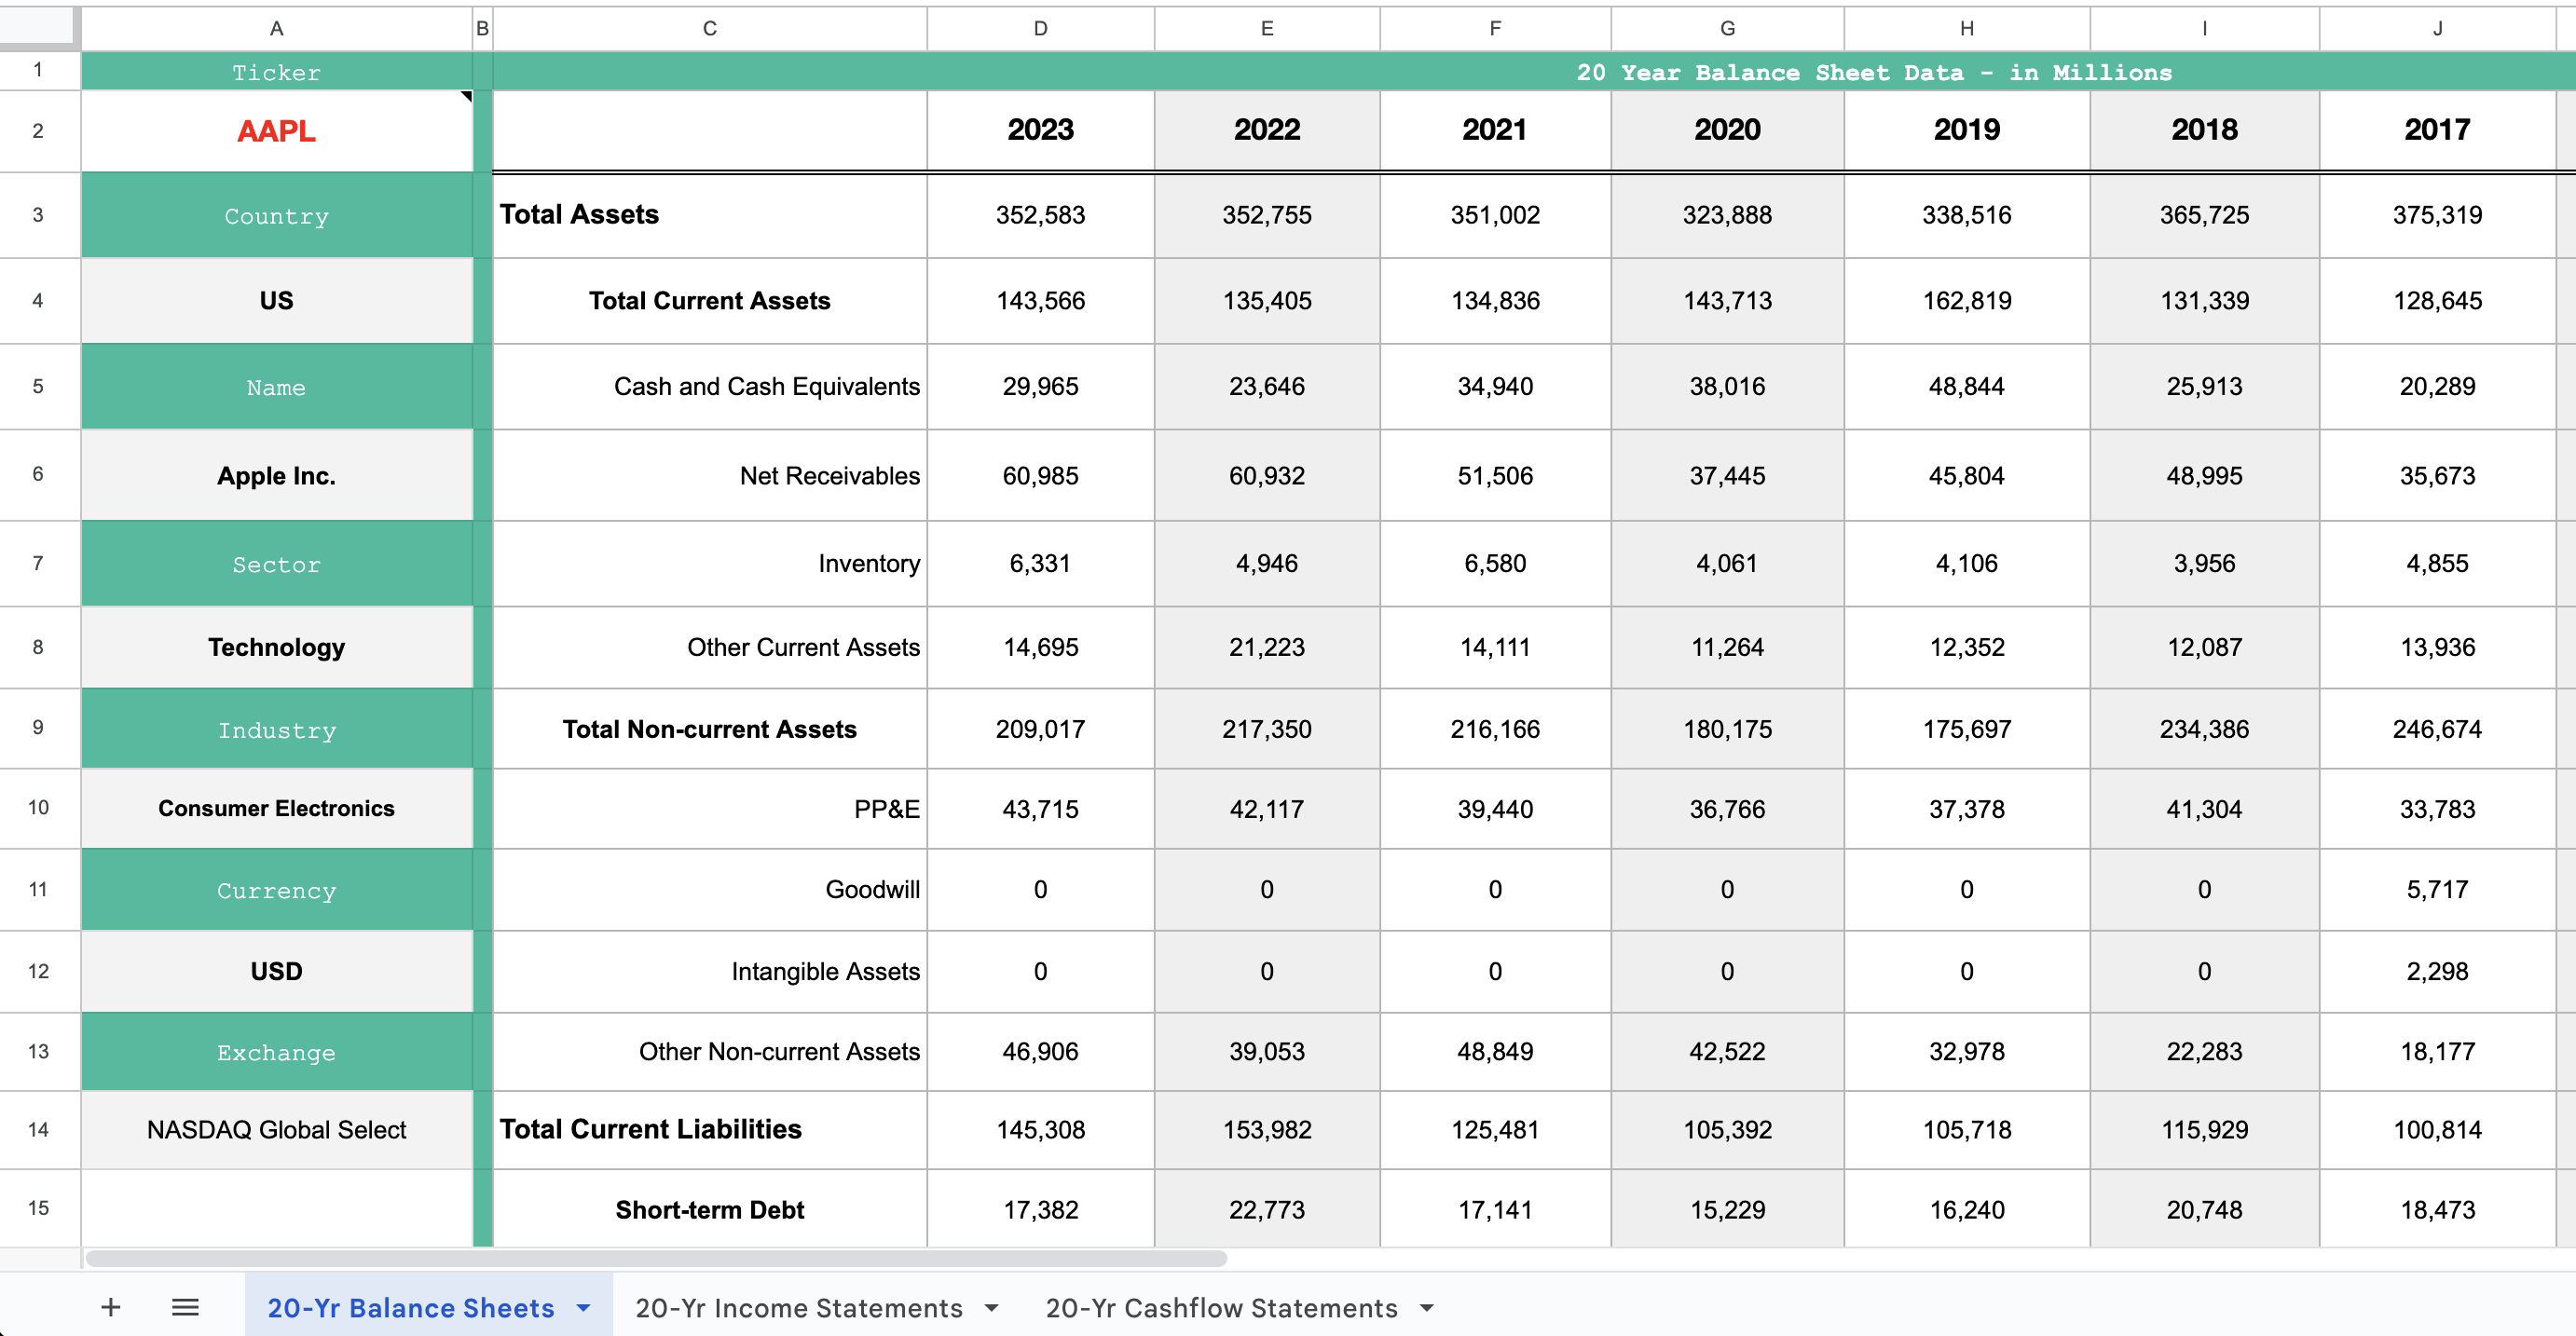
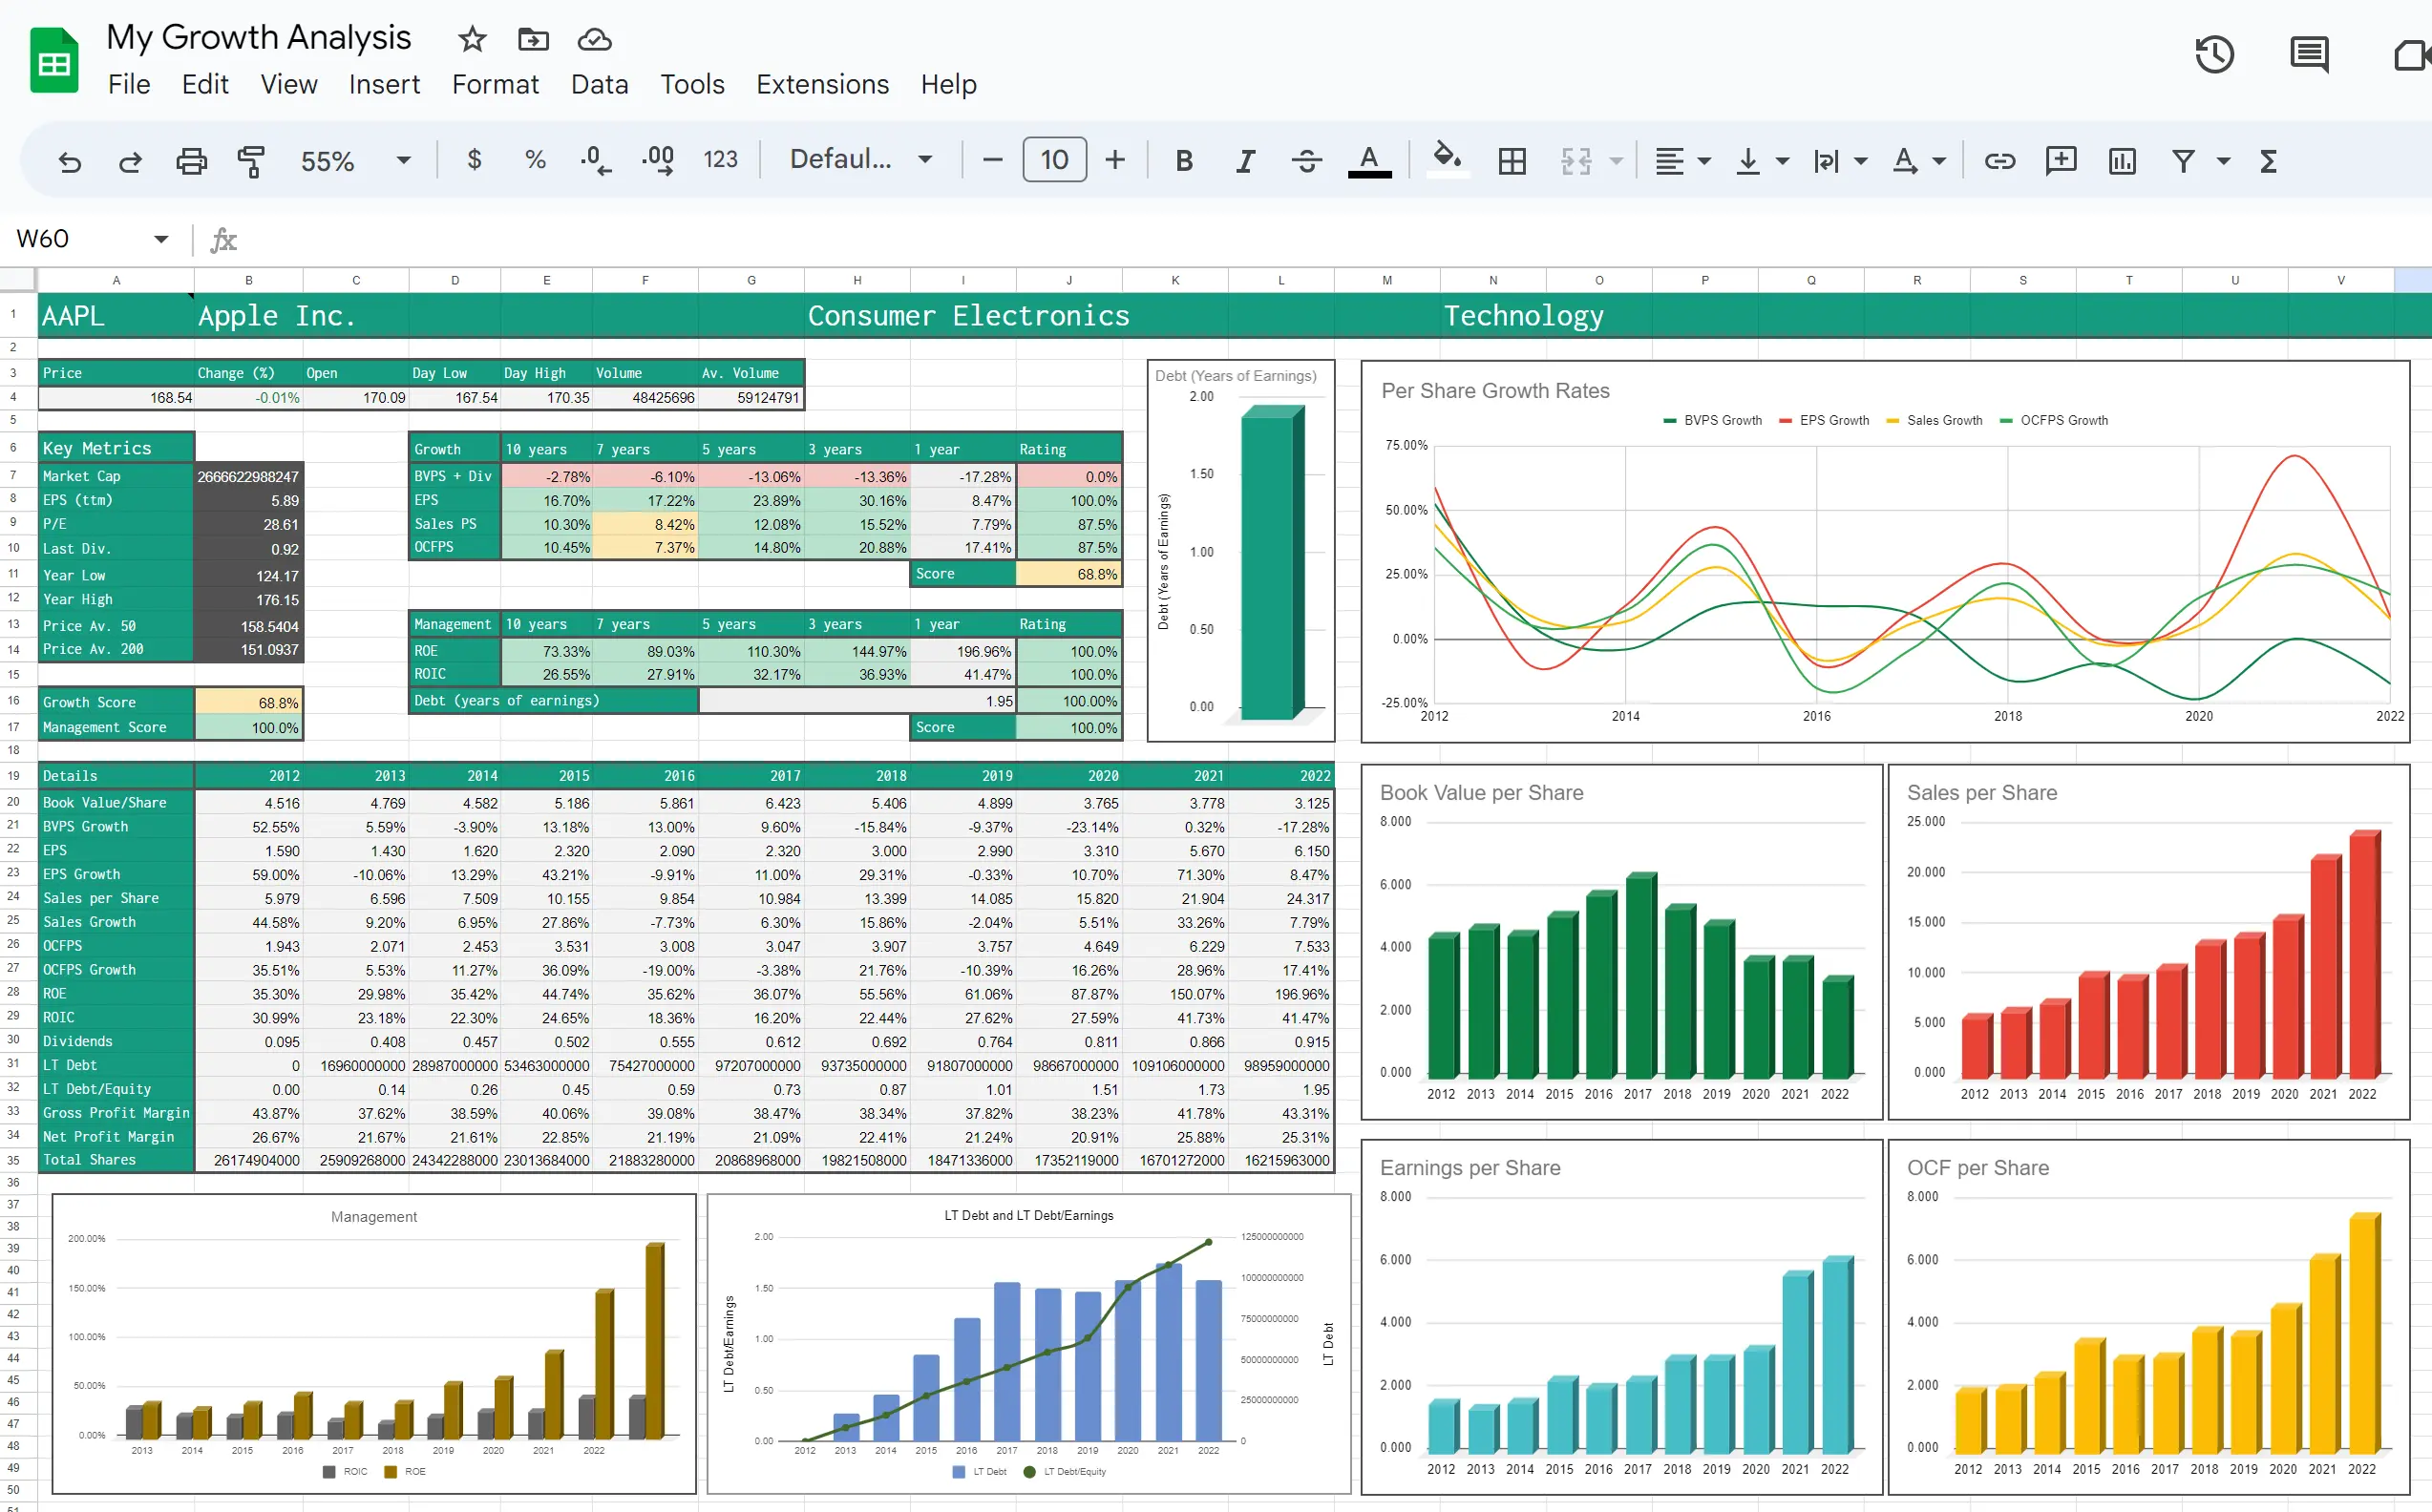
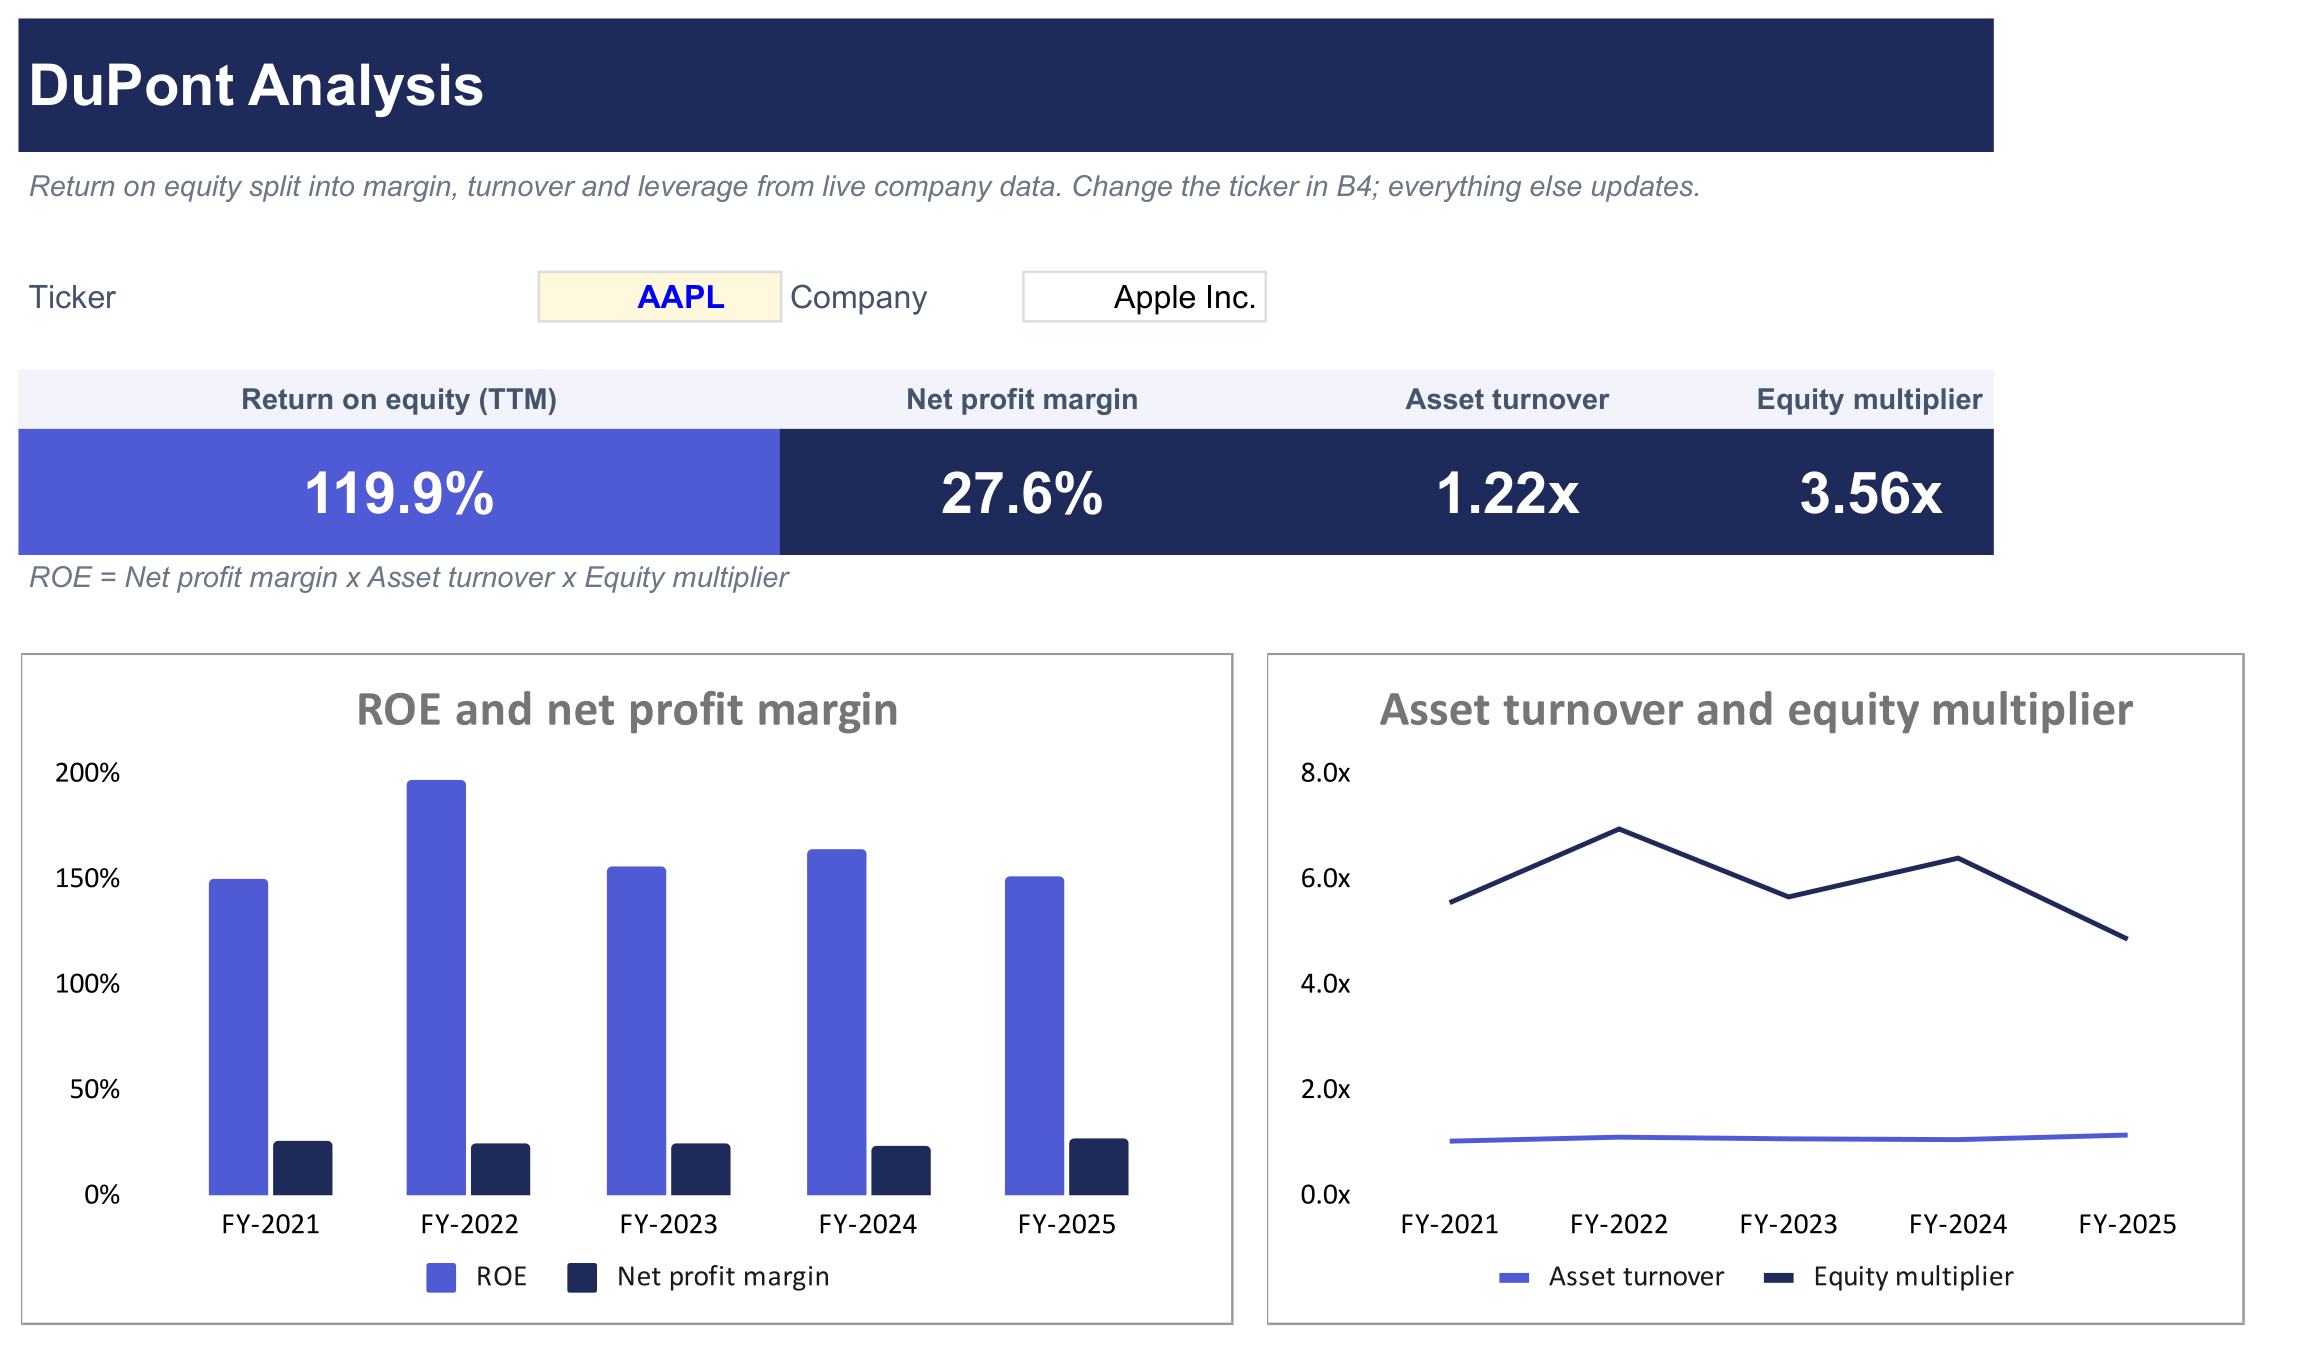
Run a DuPont analysis on any company's return on equity (ROE) from live data. Enter a ticker in cell B4 and the template pulls trailing twelve-month revenue and net income with the latest total assets and shareholders' equity, then splits ROE into net profit margin, asset turnover and the equity multiplier. Headline tiles show ROE and its three drivers, and a step-by-step build shows each ratio's formula next to the ROE SheetsFinance reports. A 5-year history repeats the breakdown for each fiscal year, with charts of ROE against net profit margin and asset turnover against the equity multiplier. Use it to see whether a company's returns come from margins, efficiency or leverage, and to compare companies in the same industry. For banks, net profit margin and asset turnover aren't comparable with published figures, though ROE is.

SheetsFinance