Microsoft Excel
Americas
6 markets USA Canada Brazil Mexico Argentina Chile
Bring real-time market data, three decades of fundamentals, brokerage sync and professional options analytics into the workbooks you already use.
No payment details required
250+ reviews · 63k+ downloads
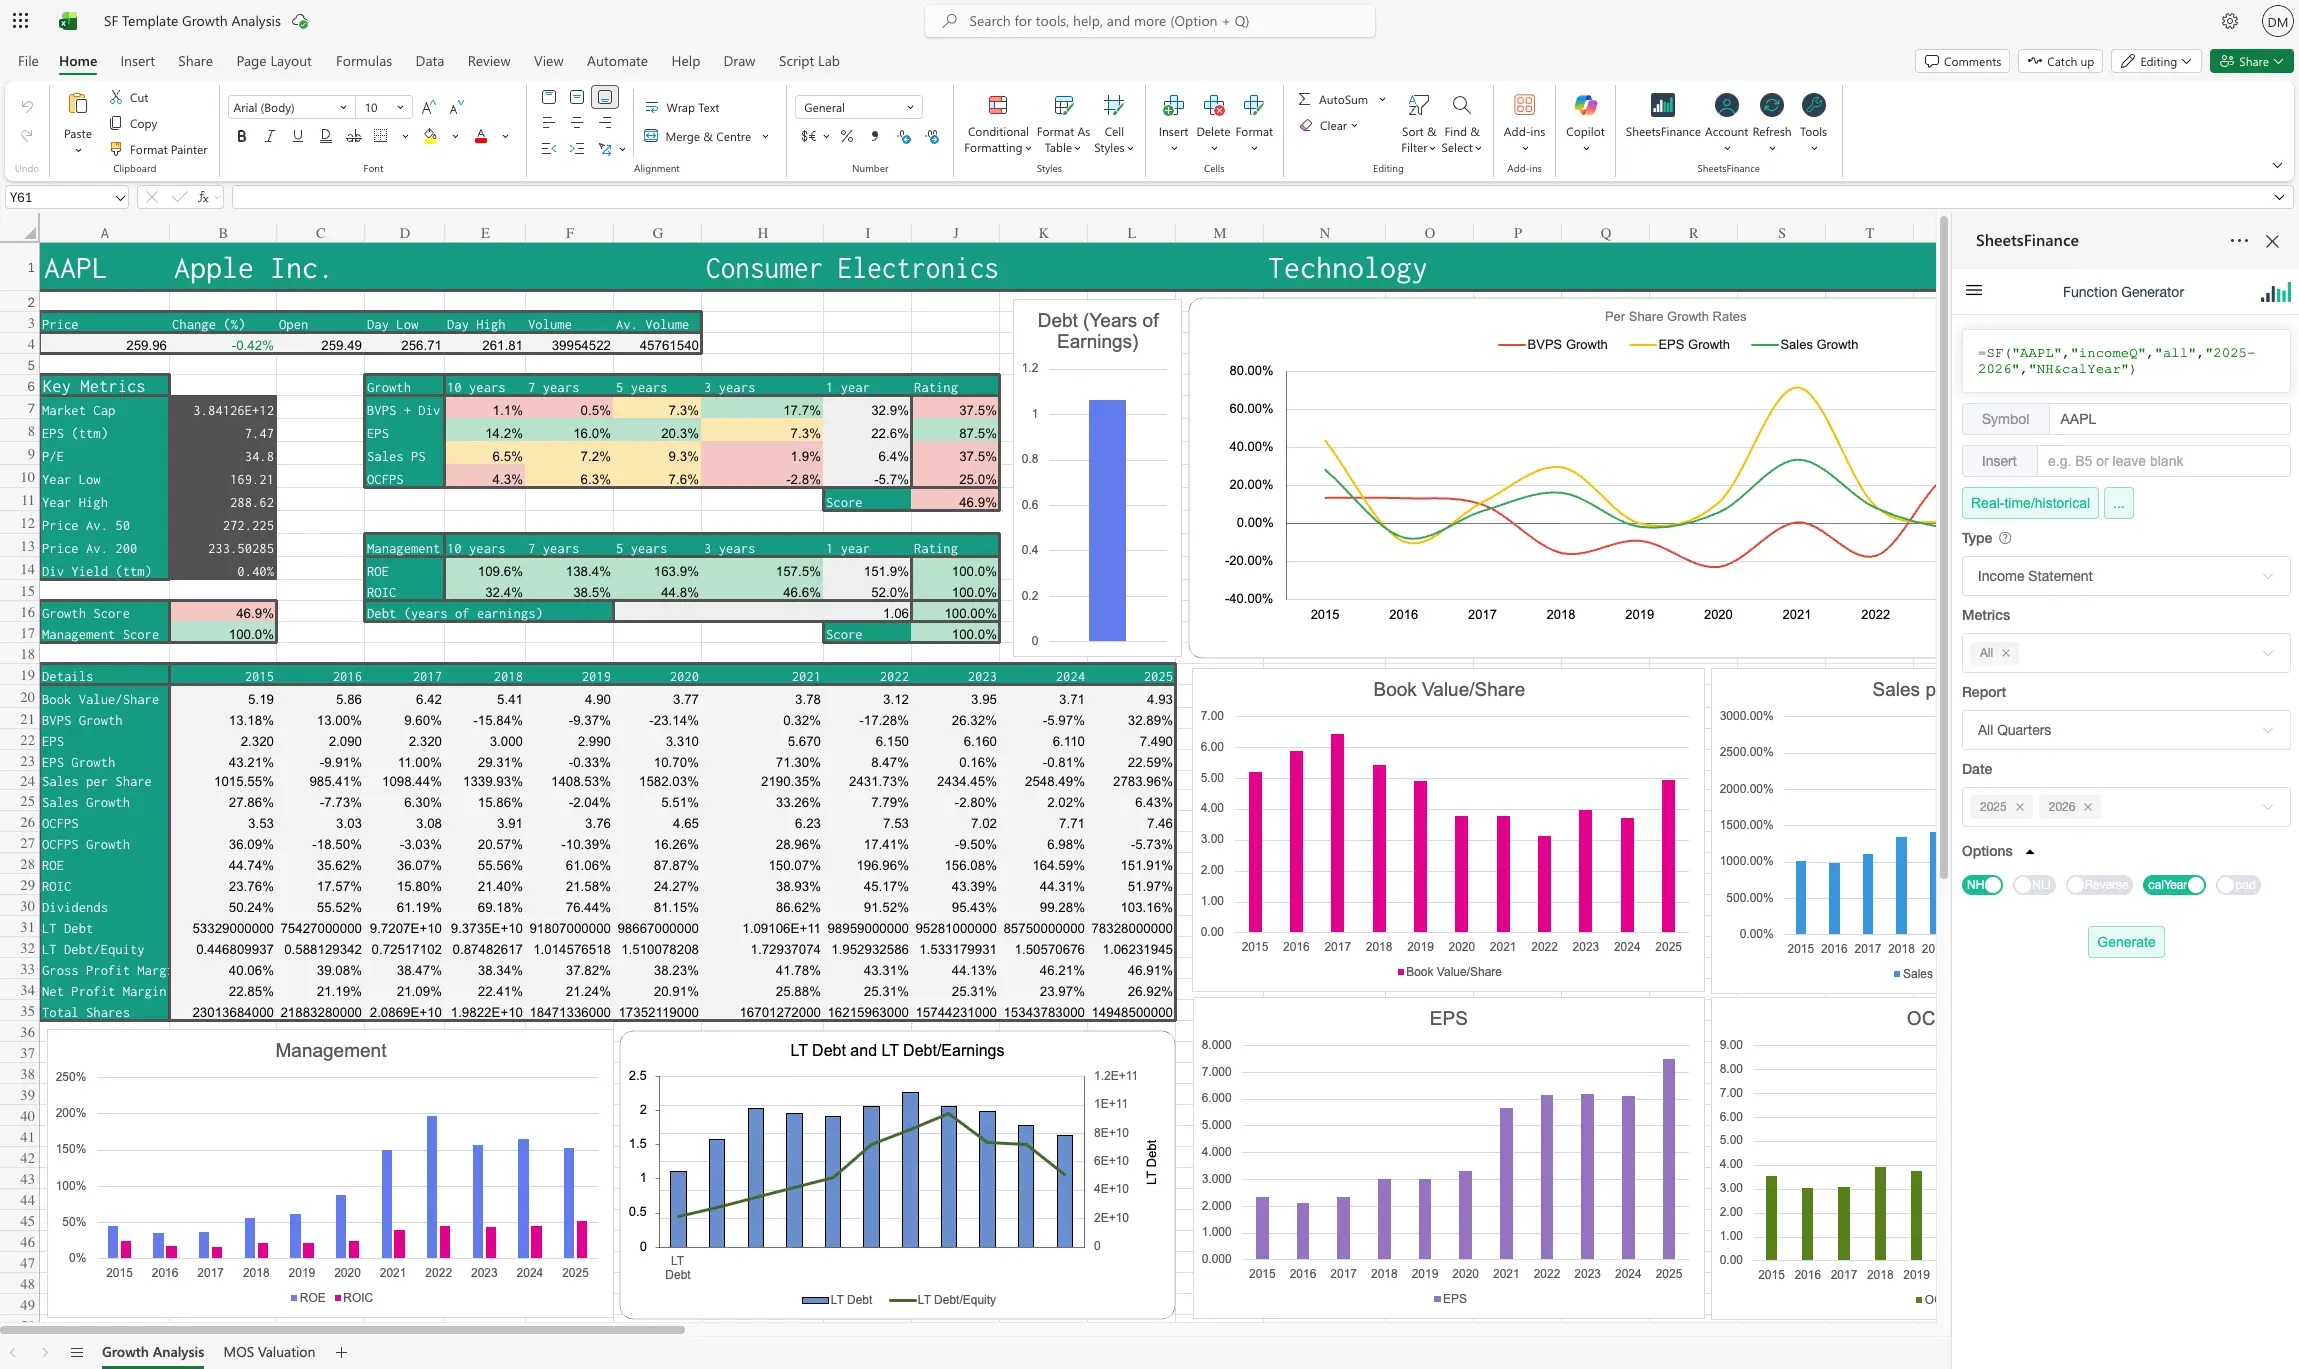


















Financial data, native to Microsoft Excel
Explore live quotes, financials, dividends, brokerage holdings and options data. Choose an example to see the formula and its spilled result.
Price quotes for 87,000+ assets, right inside Microsoft Excel.
One add-on. Three ways to power your spreadsheet.
Market data, brokerage sync and options analytics — each available on its own plan, all through simple spreadsheet functions.
Real-time prices and 30+ years of fundamentals for 87,000+ global assets.
=SF("AAPL", "income", "revenue", "ttm")Sync holdings, balances, orders and transactions from your broker — no manual entry.
=SF_BROKERAGE("my_account", "holdings")Full OPRA chains with Greeks, IV analytics and 20+ years of options history.
=SF_OPTIONS_PRO("AAPL", "calls&puts")Build your own terminal. In cells you control.
Five formulas build this desk — and it's your sheet, not ours. Rearrange it, chain metrics, wire it to your own inputs. We deliver the data, you build the desk.
One batch =SF() call pulls live price and change for the whole list.
Never write a formula
The Function Generator builds every SheetsFinance function for you. Pick the data you want, watch the formula assemble itself, and insert it straight into Microsoft Excel — no syntax to learn.
Also in the task pane
Build your own investing dashboard
Forget trawling through financial websites to find exactly what you need — design your own analysis with SheetsFinance directly in Microsoft Excel.
Everything you need for research in Excel
From live quotes and three decades of fundamentals to brokerage sync and options analytics — all through native spreadsheet functions.
Global reach
Work with 87,000+ stocks, ETFs, funds, currencies, cryptocurrencies and exchange-listed assets through one consistent Excel interface.
Global indices
S&P 500, FTSE, Nikkei...
Exchange-traded bonds
Corporate & government
6,000+ cryptocurrencies
Spot prices & history
All major FOREX pairs
Live cross rates
Commodities
Metals, energy & ags
ETFs & mutual funds
Holdings & exposure
Looking for a specific exchange? See the full list of available markets in our docs →
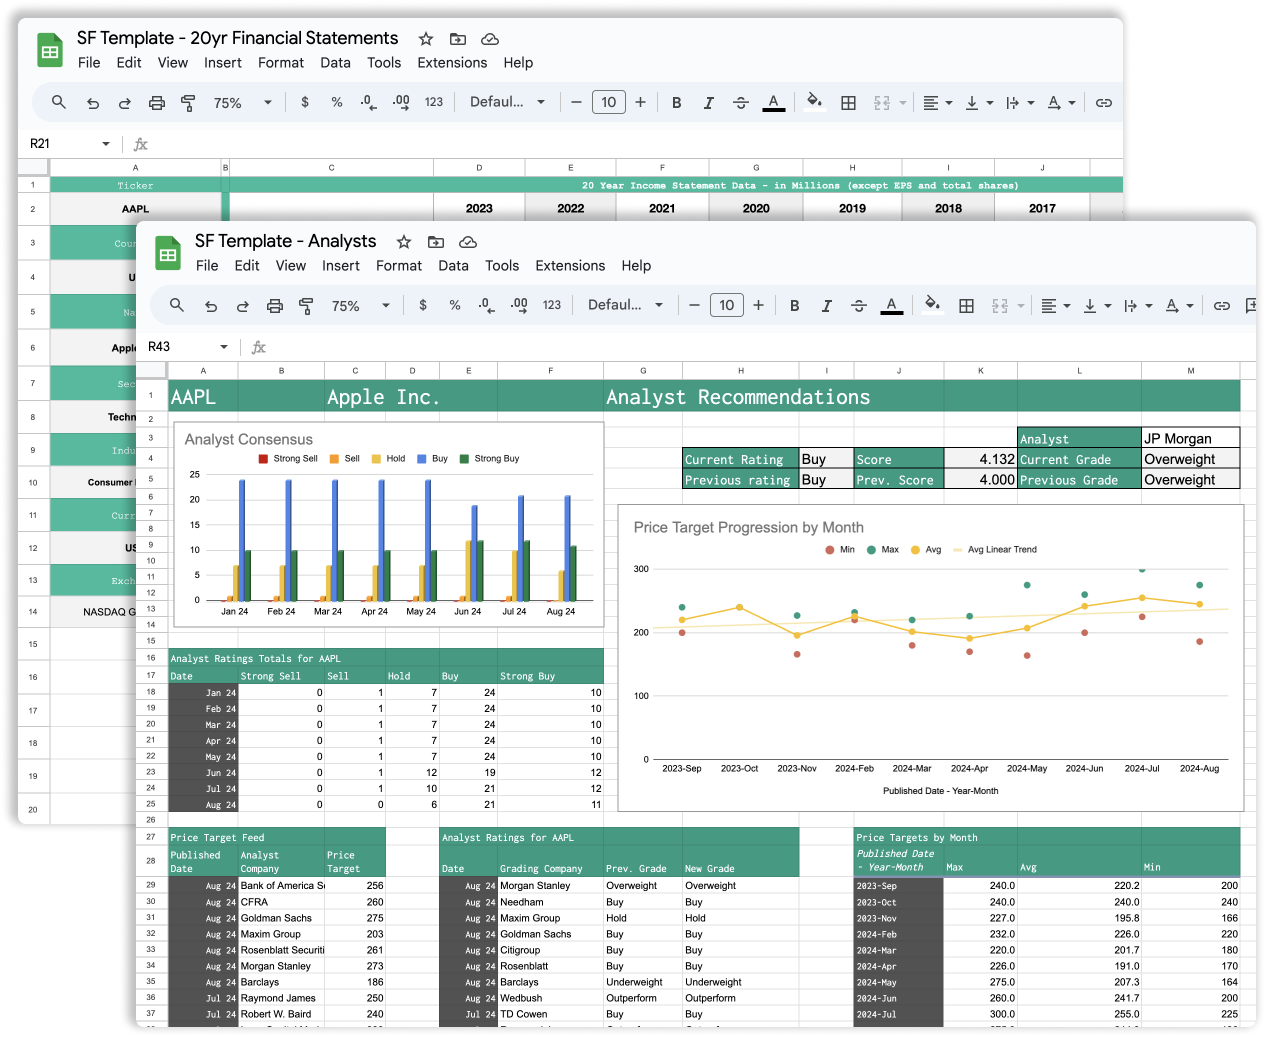
Start from a working model instead of a blank workbook
Browse our free templates for portfolio tracking, valuation, dividends and more. Many have an Excel version you can download, or open straight from the Template Library in the SheetsFinance add-in.
What our community is saying
“Sheets Finance is an incredibly powerful tool. It pulls data seamlessly from SEC filings, ensuring the data is robust and reliable. The institutional-grade mnemonics make navigating and accessing key data points effortless. What really stands out is its high utility — it saves a ton of time, covers a wide range of stocks, and offers great flexibility with customizable options. For anyone serious about financial analysis, this tool is a game changer. Highly recommend”

“Very, very helpful tool. I'm impressed by the consistancy in shape, size, and accuracy of returned data from spreadsheet-driven queries. The creators are also very responsive and helpful if there are any issues.”

“SheetsFinance is probably the best Excel add-in one can find for markets data. Democratizes access to pro tools with excellent coverage breadth that continues to grow. Customer support is helpful and responsive. Solid documentation too. Lastly, the pace of product improvement in terms of features or new data coverage is excellent. This vastly improves the value one gets out of the subscription. Can't recommend this enough.”

“Great! Simple and effective. Going to use this in all of my investing and trading spreadsheets.”

“Gives you all the finance items that google finance doesn't have. At this price, its a steal! If you do any stock analysis using google sheets, Just get it.”

“This is by far the most impressive tool I've used to do stock analysis as a retail investor. I've spend 100s of hours using dozens of online tools. They all have some sort of benefit, but I've always come back to the idea that it would be much better if I could just access the raw data and then chop it up however I need to to uncover insights about the companies. I finally found a means to do that, and imo it is done in the smartest way possible. Genuinely this is a massive value and an incredibly powerful implementation of what I've been hoping for for so long. Incredible work! Thank you.”

“Outstanding”

Book a 20-minute live demo and we'll build a working watchlist or analysis workbook with you.
Pricing
Simple plans for market data, brokerage sync and options - pick what you need, skip what you don't.
Each product is its own plan - mix and match. Compare all plans
Frequently asked questions