Google Sheets
  Microsoft Excel
Americas
6 markets USA Canada Brazil Mexico Argentina Chile
Pull 30+ years of consolidated income statements, balance sheets, cash flows, growth metrics and consistently defined ratios — annual, quarterly or TTM — directly into Google Sheets and Excel.
No payment details required
250+ reviews · 63k+ downloads
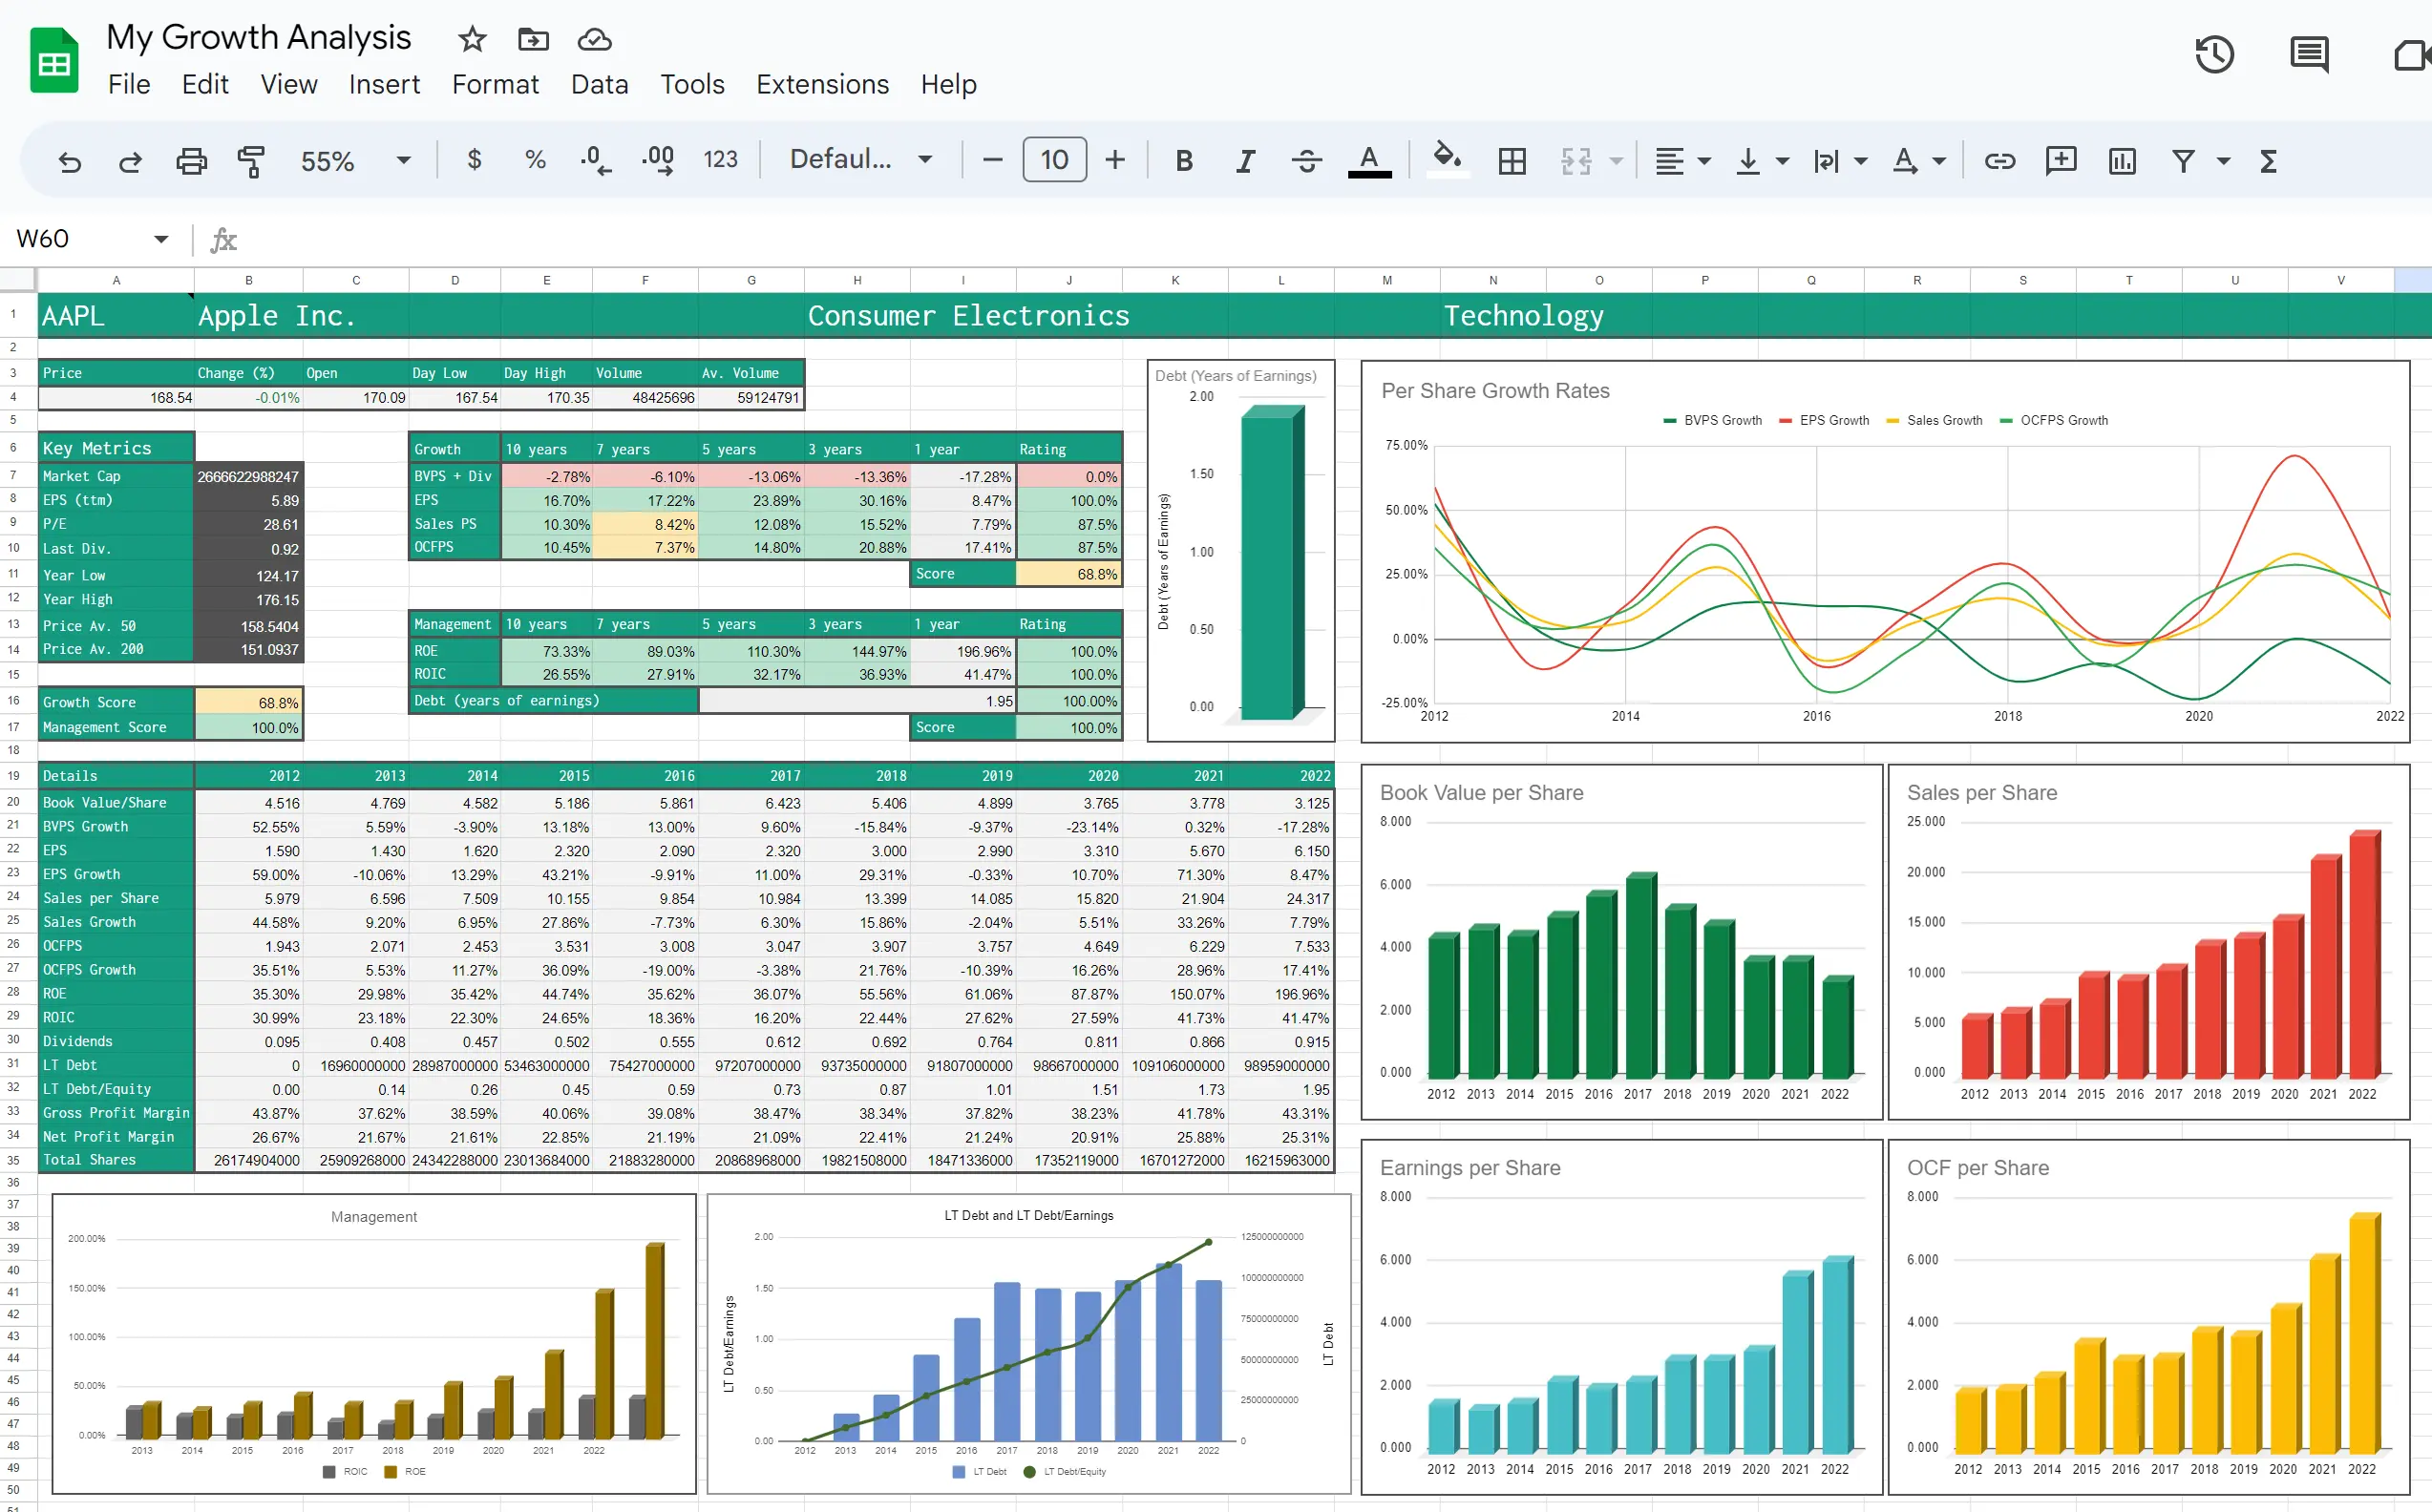


















Clean company fundamentals, ready to compare
Move between consolidated statements, year-over-year ratios and growth data without rebuilding or cleaning every dataset yourself.
Compare a cleaned, consolidated income statement across five reporting years.
No-code workflow
The Function Generator turns every SheetsFinance market-data function into guided controls. Choose a symbol, dataset, metrics, reporting period and options, then generate a ready-to-use formula for Google Sheets or Excel.
Also in the sidebar
Filter 87,000+ assets using hundreds of market and fundamental metrics.
Find companies, funds, crypto, forex pairs and other instruments by name or ticker.
Start with a ready-made analysis, then customize it with formulas generated for you.
Everything you need for fundamental analysis
Consolidated, cleaned and consistently defined statements, ratios, ownership and specialist datasets for 87,000+ companies.
Global reach
Research companies across major markets with consistent statements, ratios and reporting-period controls delivered through the same spreadsheet workflow.
Income statements
Revenue, margins and earnings
Balance sheets
Assets, liabilities and equity
Cash flows
Operations, capex and free cash flow
100+ ratios
Profitability, solvency and valuation
Flexible periods
Annual, quarterly, fiscal or calendar
Growth metrics
Comparable year-over-year trends
Looking for a specific exchange? See the full list of available markets in our docs →
Company fundamentals are included in every Market Data plan
Every plan starts with a 15-day free trial. No payment details required.
Book a 20-minute live demo and we'll build a statements, ratios and valuation workflow around a company you follow.
Testimonials
“Gives you all the finance items that google finance doesn't have. At this price, its a steal! If you do any stock analysis using google sheets, Just get it.”
“Worth it. Constantly updating the extension. Seems genuinely interested in improving. The extension has helped me streamline my stock watchlists as a value investor.”
“Sheets Finance is an incredibly powerful tool. It pulls data seamlessly from SEC filings, ensuring the data is robust and reliable. The institutional-grade mnemonics make navigating and accessing key data points effortless. What really stands out is its high utility — it saves a ton of time, covers a wide range of stocks, and offers great flexibility with customizable options. For anyone serious about financial analysis, this tool is a game changer. Highly recommend”
“SheetsFinance functions are really helpful to identify good/stable fundamental stocks, calculate RSI, MACD, VWAP on daily basis. There are options to calculate these in Intraday also. Thanks SheetsFinance team to create this excellent functions/application. SheetsFinance customer support team is also very helpful to answer queries.”
“I like how easy to use this app. I’ve got all the numbers I was looking for and was building dashboard right away.”
Frequently asked questions