Key Ratios
The ratios is a powerful data type connects you with 100s of annual, quarterly and TTM financial ratios for a stock. You can display a single ratio or multiple ratios at once. You can also display multiple years of ratios at once, both annual and quarterly with one function call. A series of examples are provided below.
=SF(symbol, type, metrics, year(s), options)symbolis the ticker symbol of the financial asset (e.g.,"AAPL"). You can use our Symbol Search to find the correct ticker symbol.typeis where you specify which type of ratios you are after, leave it as just"ratios"for annual ratios or append the quarter for quarterly ratios, for example"ratiosQ1"for Q1 ratios or"ratiosQ2"for Q2 ratios.metricsis the ratio(s) you are after, for example"roe"or"revenuePerShare&roe¤tRatio". You can leave this blank or set it to"all"to output ALL available ratios. You can also chain together multiple ratios using the&operator, for example"roe¤tRatio". See the full list of over 100 available ratios below.yearis the year for the ratios, e.g.,"2020". This can also be set to a range of years, e.g."2010-2020"to return multiple years of financial ratios, both quarterly and annual, in one call. Lastly, this can be set to"ttm"to return the TTM ratios.optionsadjusts the formatting of the output. There are currently four (5) available options. (1)"NH"for no header rows, (2)"NLI"for no line item labels, (3)"-"to reverse the year ordering, (4)"calYear"which adjusts the search to calendar years instead of fiscal years and (5)"pad"which adds padding of empty columns to the output for missing years or quarters. These options can be chained together with the&operator, for example"NH&NLI&-".
Tips:
You can enter a range of years for both annual and quarterly ratios, e.g.,
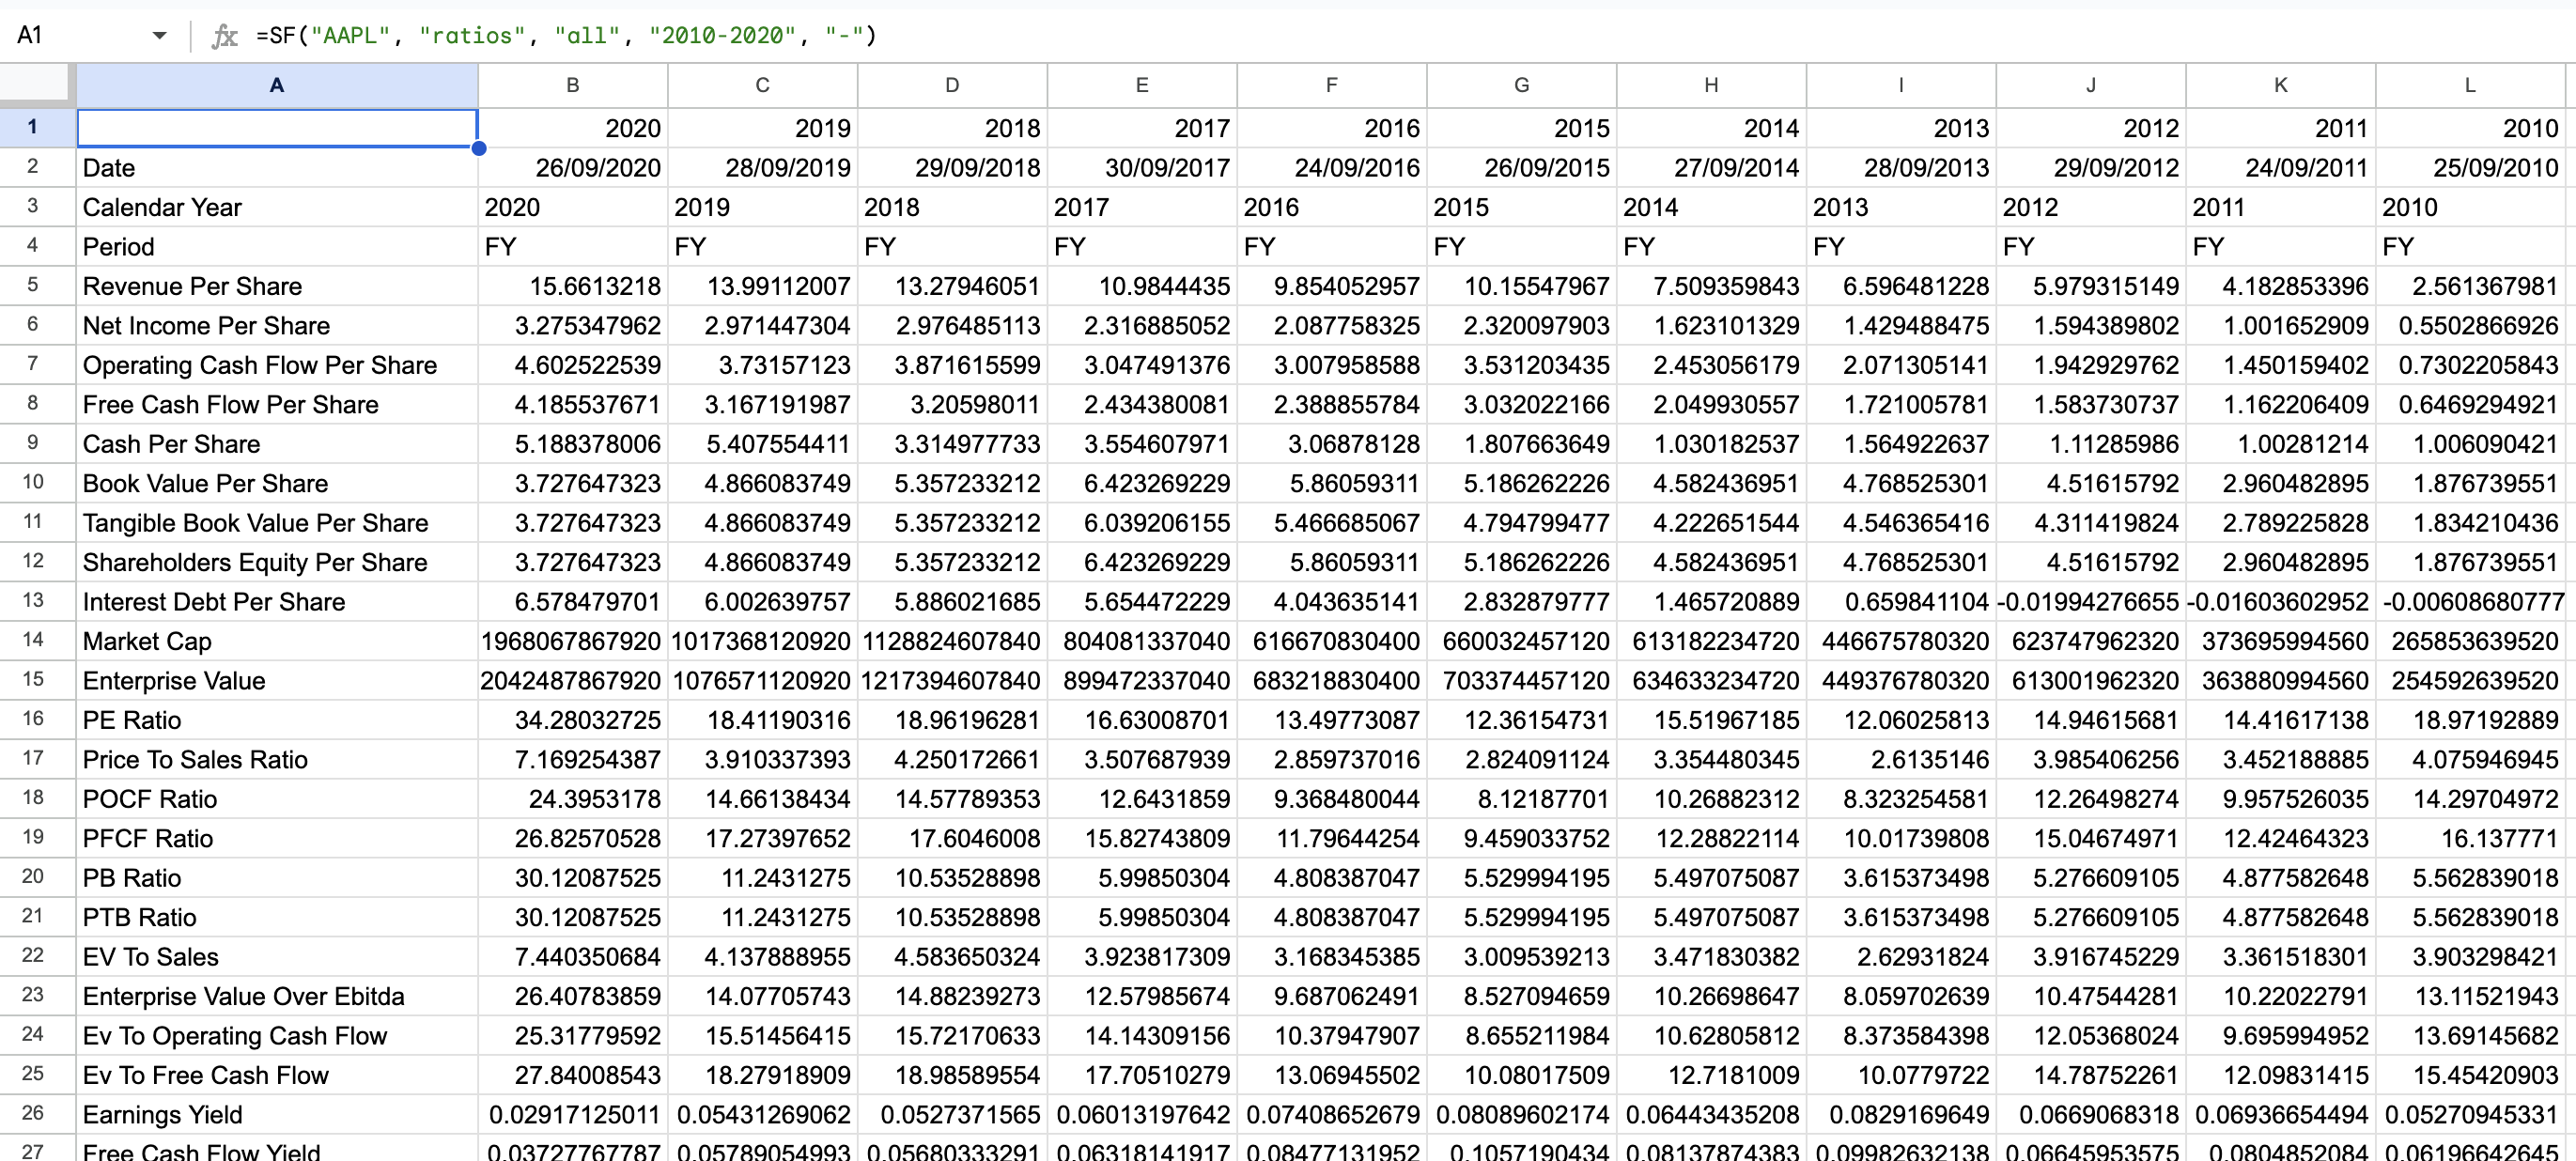
"2015-2021"and get multiple years output side-by-side.Use the options parameter to remove the header rows, line item label and reversing the year ordering.
If you input a range of years and don't specify the quarter number, e.g.
=SF("AAPL", "ratiosQ", "all", "2010-2020")you will be returned all quarters for each year in the range.If you do not provide the
yearparameter this function will default to the most recently reported ratios (not ttm), for both annual and quarterly data.
The ratios data type has the following metrics to select from:
All (
"all")Date (
"date")Fiscal Year (
"fiscalYear")Period (
"period")Reported Currency (
"reportedCurrency")Gross Profit Margin (
"grossProfitMargin")EBIT Margin (
"ebitMargin")EBITDA Margin (
"ebitdaMargin")Operating Profit Margin (
"operatingProfitMargin")Pretax Profit Margin (
"pretaxProfitMargin")Continuous Operations Profit Margin (
"continuousOperationsProfitMargin")Net Profit Margin (
"netProfitMargin")Bottom Line Profit Margin (
"bottomLineProfitMargin")Receivables Turnover (
"receivablesTurnover")Payables Turnover (
"payablesTurnover")Inventory Turnover (
"inventoryTurnover")Fixed Asset Turnover (
"fixedAssetTurnover")Asset Turnover (
"assetTurnover")Current Ratio (
"currentRatio")Quick Ratio (
"quickRatio")Solvency Ratio (
"solvencyRatio")Cash Ratio (
"cashRatio")Price To Earnings Ratio (
"priceToEarningsRatio")Price To Earnings Growth Ratio (
"priceToEarningsGrowthRatio")Forward Price To Earnings Growth Ratio (
"forwardPriceToEarningsGrowthRatio")Price To Book Ratio (
"priceToBookRatio")Price To Sales Ratio (
"priceToSalesRatio")Price To Free Cash Flow Ratio (
"priceToFreeCashFlowRatio")Price To Operating Cash Flow Ratio (
"priceToOperatingCashFlowRatio")Debt To Assets Ratio (
"debtToAssetsRatio")Debt To Equity Ratio (
"debtToEquityRatio")Debt To Capital Ratio (
"debtToCapitalRatio")Long Term Debt To Capital Ratio (
"longTermDebtToCapitalRatio")Financial Leverage Ratio (
"financialLeverageRatio")Working Capital Turnover Ratio (
"workingCapitalTurnoverRatio")Operating Cash Flow Ratio (
"operatingCashFlowRatio")Operating Cash Flow Sales Ratio (
"operatingCashFlowSalesRatio")Free Cash Flow Operating Cash Flow Ratio (
"freeCashFlowOperatingCashFlowRatio")Debt Service Coverage Ratio (
"debtServiceCoverageRatio")Interest Coverage Ratio (
"interestCoverageRatio")Short Term Operating Cash Flow Coverage Ratio (
"shortTermOperatingCashFlowCoverageRatio")Operating Cash Flow Coverage Ratio (
"operatingCashFlowCoverageRatio")Capital Expenditure Coverage Ratio (
"capitalExpenditureCoverageRatio")Dividend Paid And Capex Coverage Ratio (
"dividendPaidAndCapexCoverageRatio")Dividend Payout Ratio (
"dividendPayoutRatio")Dividend Yield (
"dividendYield")Enterprise Value (
"enterpriseValue")Revenue Per Share (
"revenuePerShare")Net Income Per Share (
"netIncomePerShare")Interest Debt Per Share (
"interestDebtPerShare")Cash Per Share (
"cashPerShare")Book Value Per Share (
"bookValuePerShare")Tangible Book Value Per Share (
"tangibleBookValuePerShare")Shareholders Equity Per Share (
"shareholdersEquityPerShare")Operating Cash Flow Per Share (
"operatingCashFlowPerShare")Capex Per Share (
"capexPerShare")Free Cash Flow Per Share (
"freeCashFlowPerShare")Net Income Per EBT (
"netIncomePerEbt")EBT Per EBIT (
"ebtPerEbit")Price To Fair Value (
"priceToFairValue")Debt To Market Cap (
"debtToMarketCap")Effective Tax Rate (
"effectiveTaxRate")Enterprise Value Multiple (
"enterpriseValueMultiple")Dividend Per Share (
"dividendPerShare")Market Cap (
"marketCap")EV To Sales (
"evToSales")EV To Operating Cash Flow (
"evToOperatingCashFlow")EV To Free Cash Flow (
"evToFreeCashFlow")EV To EBITDA (
"evToEBITDA")Net Debt To EBITDA (
"netDebtToEBITDA")Income Quality (
"incomeQuality")Graham Number (
"grahamNumber")Graham Net Net (
"grahamNetNet")Tax Burden (
"taxBurden")Interest Burden (
"interestBurden")Working Capital (
"workingCapital")Invested Capital (
"investedCapital")Return On Assets (
"returnOnAssets")Operating Return On Assets (
"operatingReturnOnAssets")Return On Tangible Assets (
"returnOnTangibleAssets")Return On Equity (
"returnOnEquity")Return On Invested Capital (
"returnOnInvestedCapital")Return On Capital Employed (
"returnOnCapitalEmployed")Earnings Yield (
"earningsYield")Free Cash Flow Yield (
"freeCashFlowYield")Capex To Operating Cash Flow (
"capexToOperatingCashFlow")Capex To Depreciation (
"capexToDepreciation")Capex To Revenue (
"capexToRevenue")Sales General And Administrative To Revenue (
"salesGeneralAndAdministrativeToRevenue")Research And Development To Revenue (
"researchAndDevelopementToRevenue")Stock Based Compensation To Revenue (
"stockBasedCompensationToRevenue")Intangibles To Total Assets (
"intangiblesToTotalAssets")Average Receivables (
"averageReceivables")Average Payables (
"averagePayables")Average Inventory (
"averageInventory")Days Of Sales Outstanding (
"daysOfSalesOutstanding")Days Of Payables Outstanding (
"daysOfPayablesOutstanding")Days Of Inventory Outstanding (
"daysOfInventoryOutstanding")Operating Cycle (
"operatingCycle")Cash Conversion Cycle (
"cashConversionCycle")Free Cash Flow To Equity (
"freeCashFlowToEquity")Free Cash Flow To Firm (
"freeCashFlowToFirm")Tangible Asset Value (
"tangibleAssetValue")Net Current Asset Value (
"netCurrentAssetValue")
Examples
Example 1 - Single metric (ROE)
=SF("AAPL", "ratios", "returnOnEquity", "2020")

0.8786635853012749
Example 2 - Multiple annual metrics (ROE & Current Ratio)
=SF("AAPL", "ratios", "returnOnEquity¤tRatio", "2020")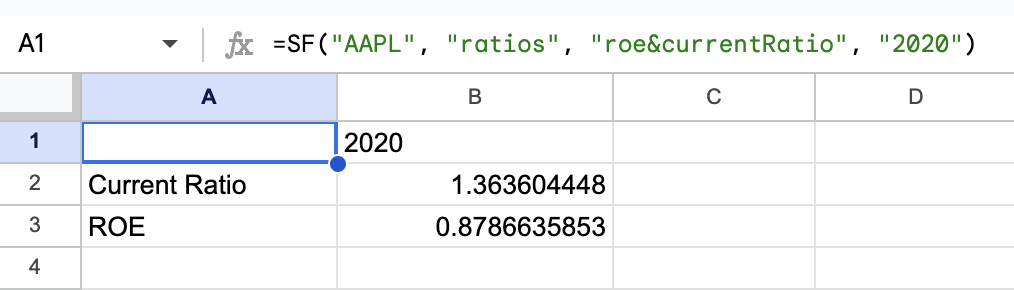
Example 3 - Multiple years and all metrics
=SF("AAPL", "ratios", "all", "2012-2022")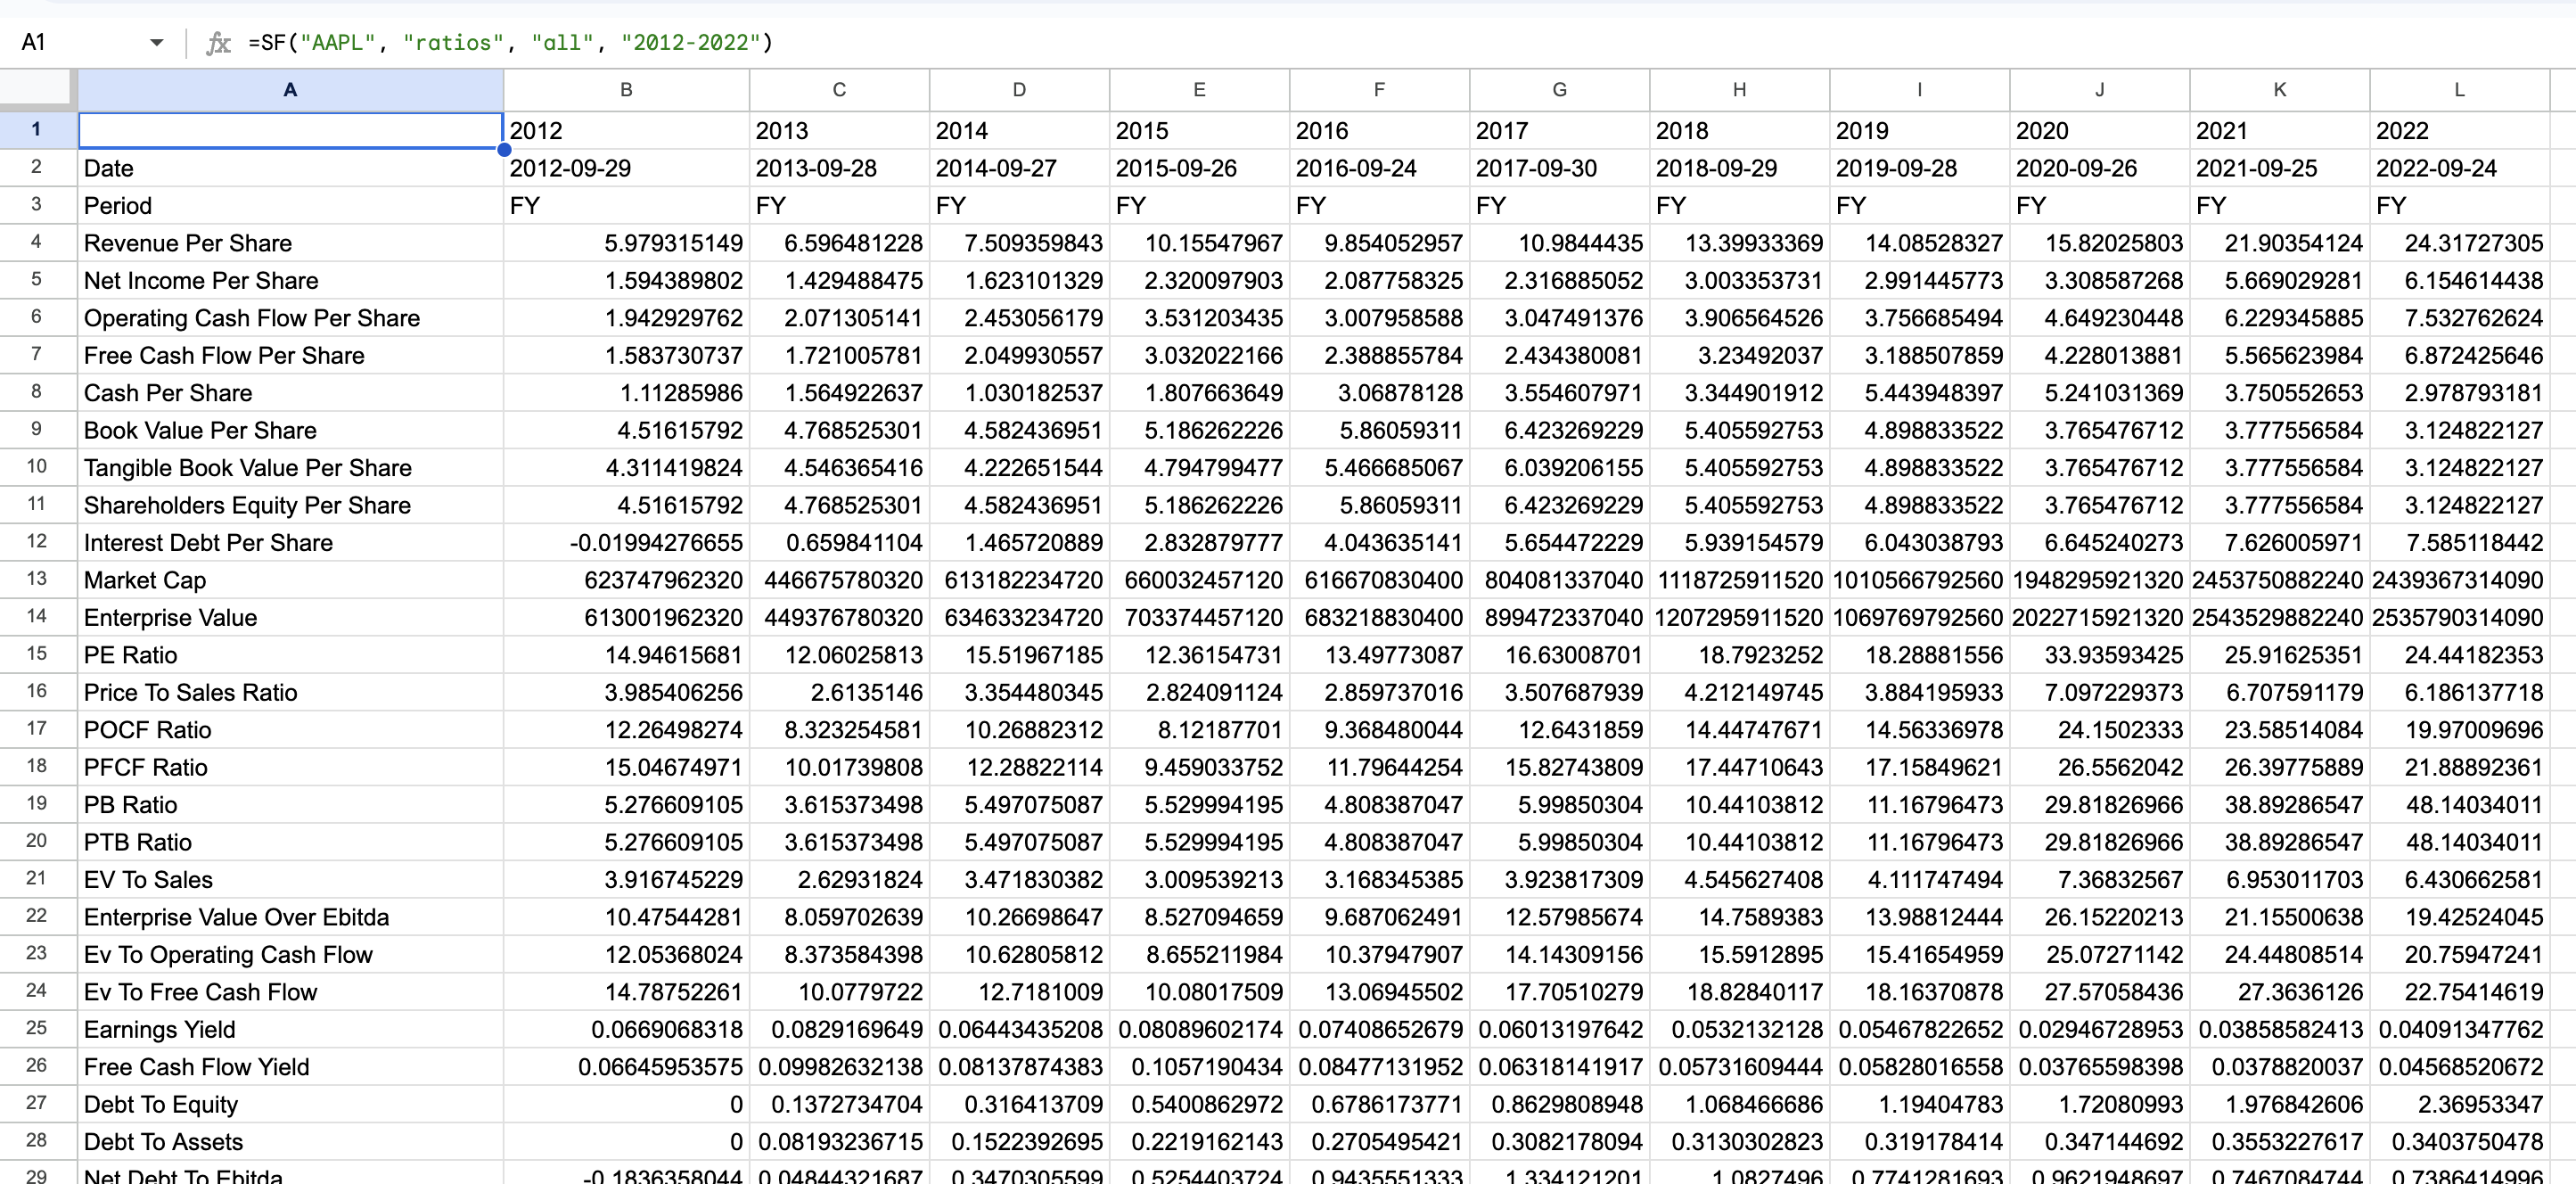
Example 4 - All TTM ratios
=SF("AAPL", "ratios", "all", "ttm")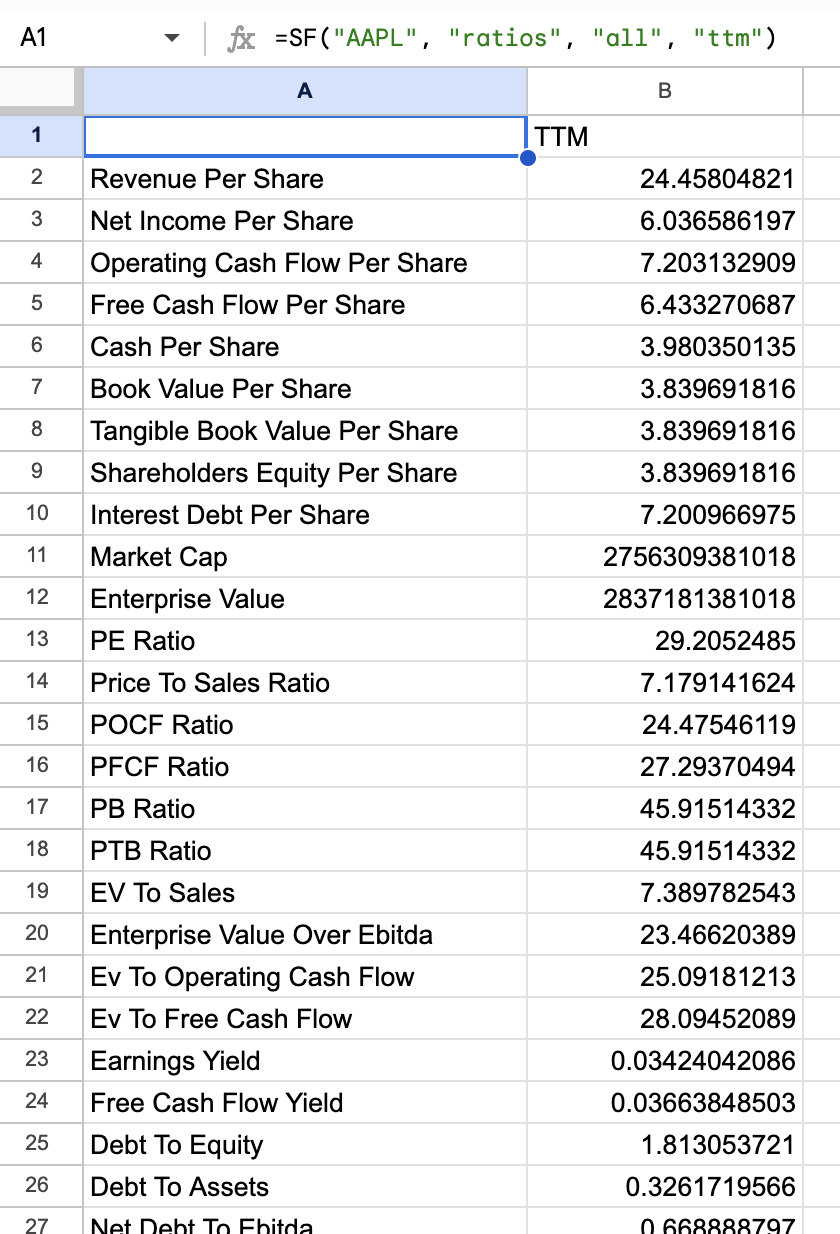
Example 5 - Quarterly ratios for Q4 2022
=SF("AAPL", "ratiosQ4", "all", "2022")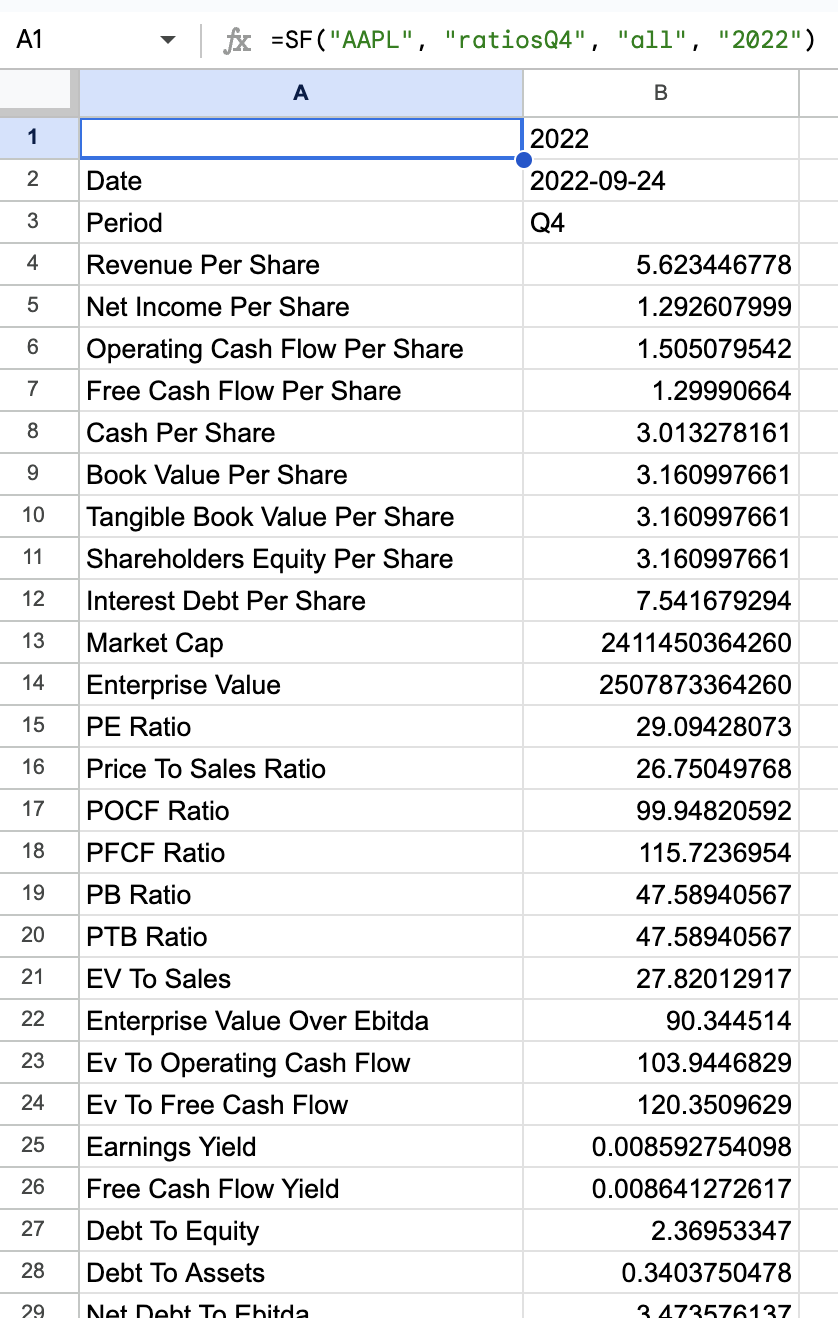
Example 6 - Several TTM ratios with no header rows and no line item labels
=SF("AAPL", "ratios", "currentRatio&revenuePerShare&returnOnEquity&grossProfitMargin", "ttm", "NH&NLI")
Example 7 - Multiple years and reversed year ordering
=SF("AAPL", "ratios", "all", "2010-2020", "-")