Google Sheets
  Microsoft Excel
Americas
6 markets USA Canada Brazil Mexico Argentina Chile
Real-time prices and 30+ years of financial statements, dividends, analyst ratings, technicals and news - 87,000+ assets across 60+ global exchanges, through simple spreadsheet functions.
226+ reviews · 61k+ downloads
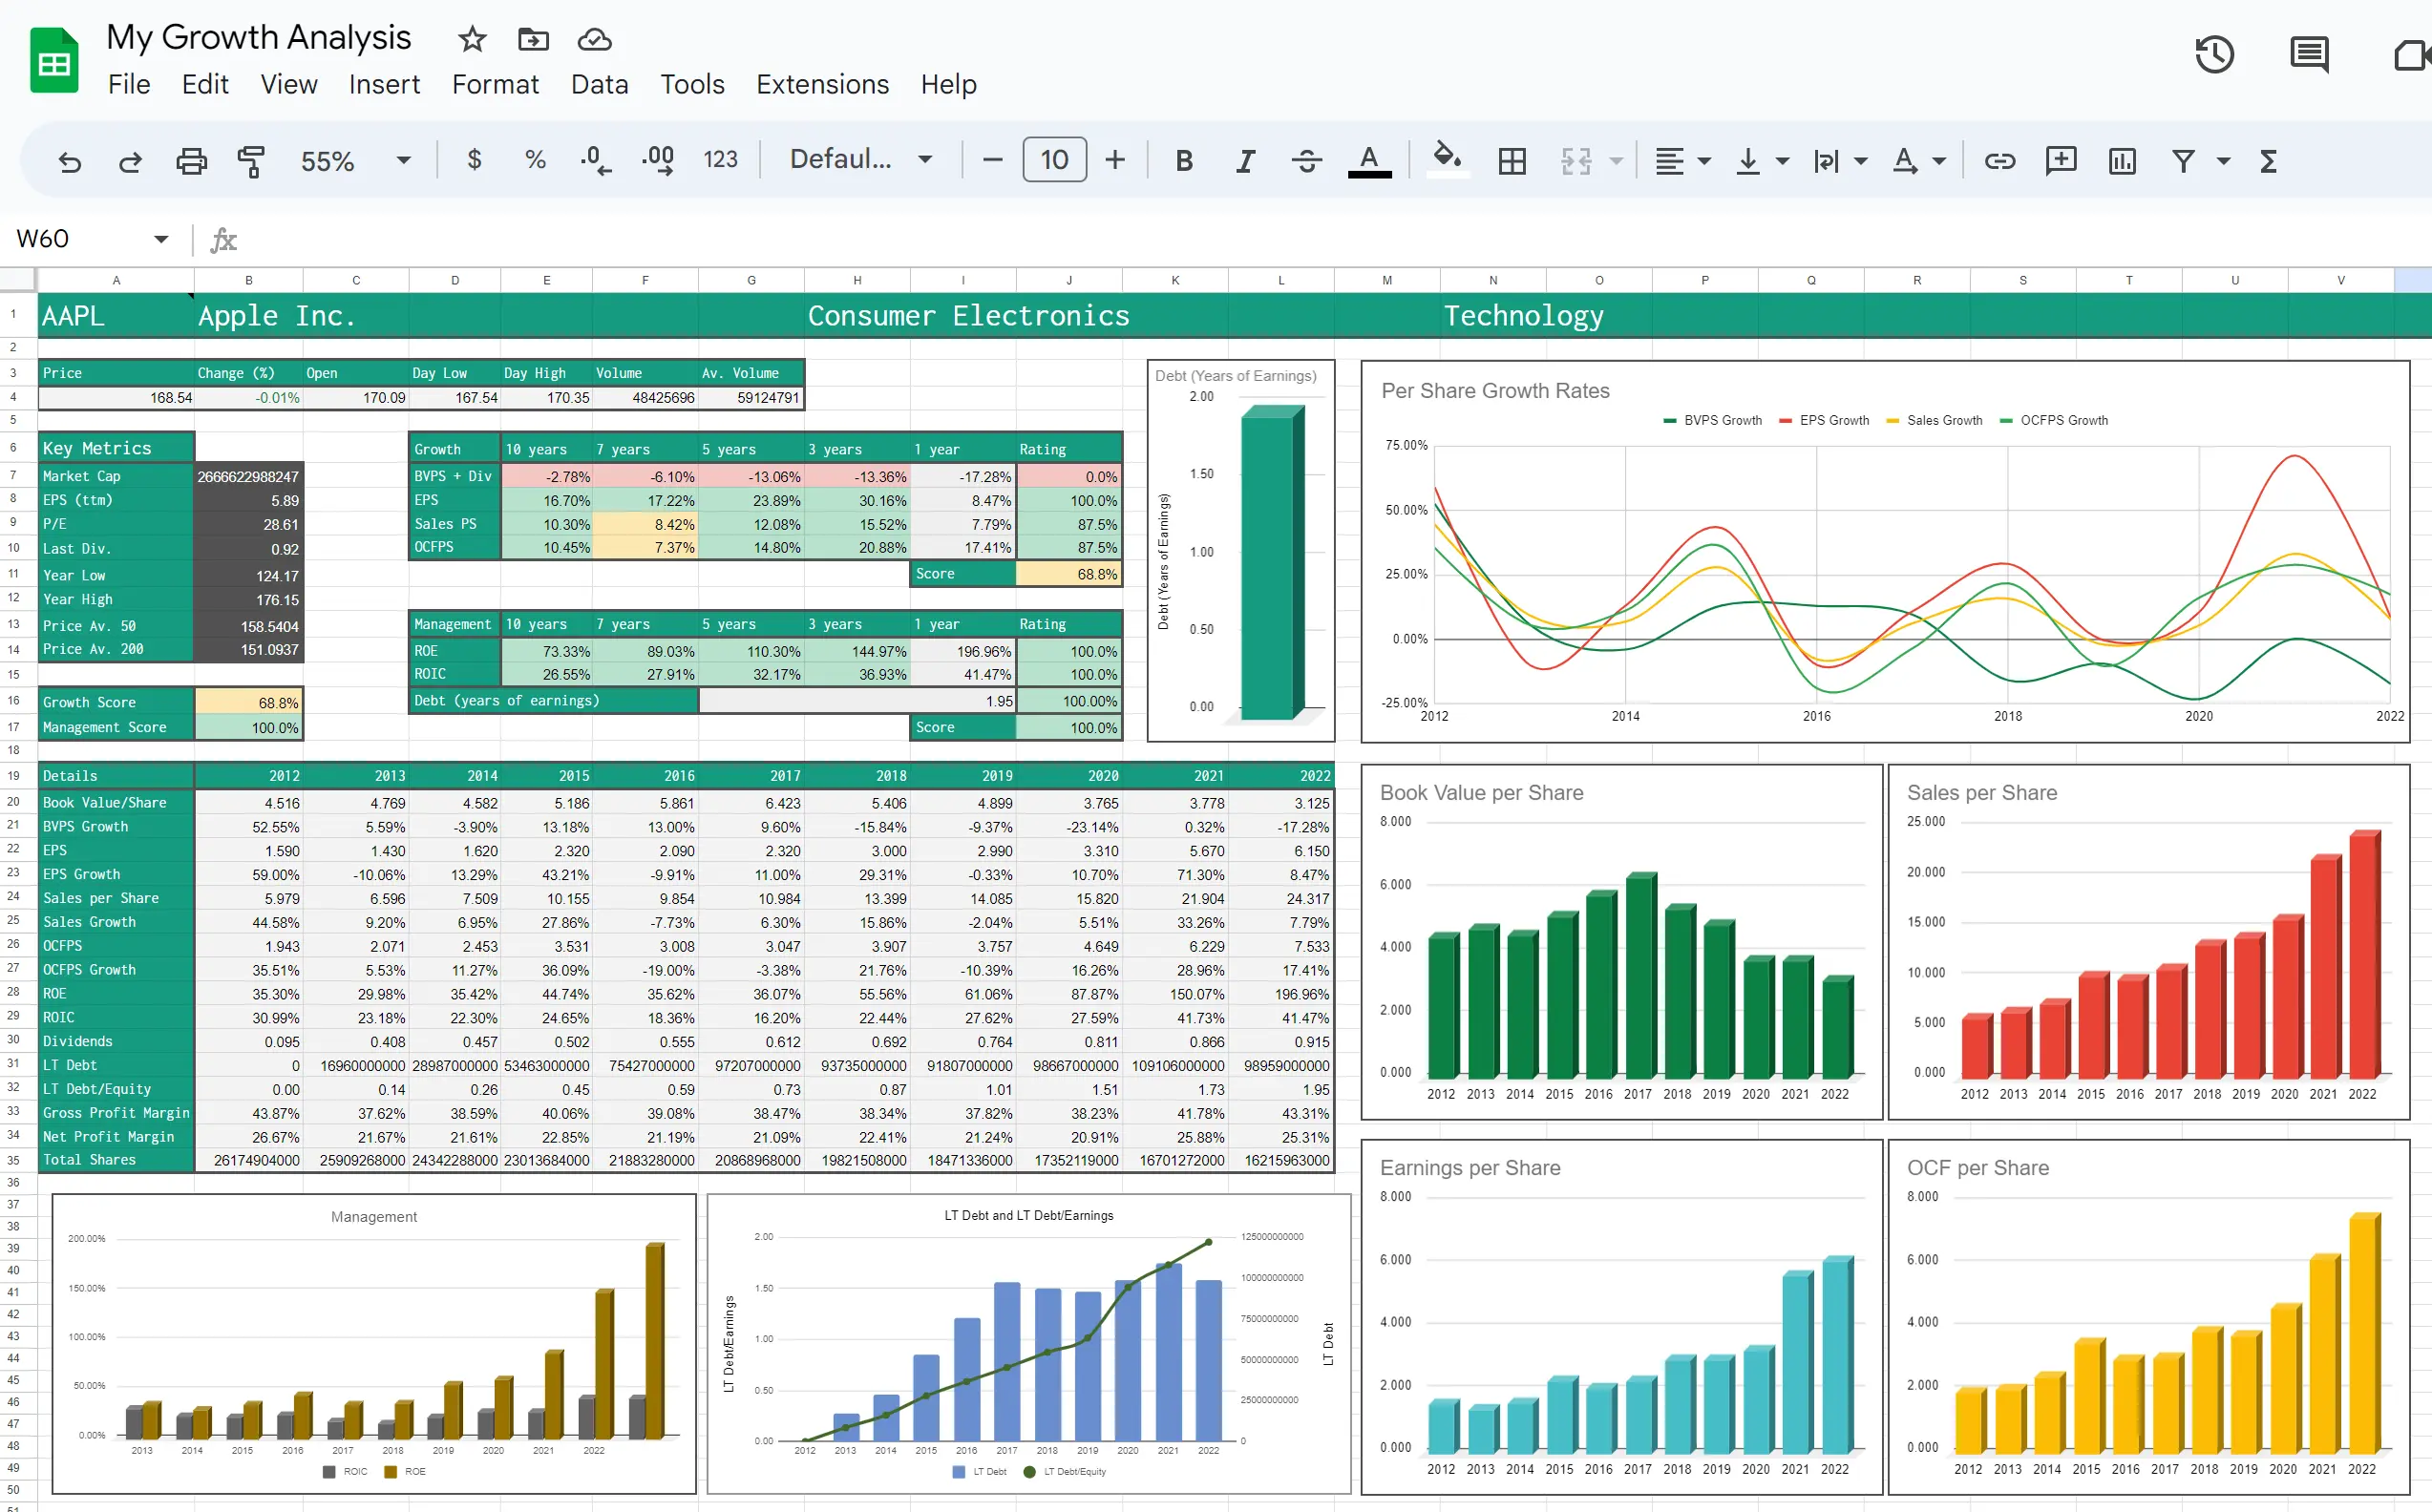


















Simple functions. Powerful market data.
Choose an example to see how SheetsFinance turns complex market datasets into clean, analysis-ready tables in your spreadsheet.
Live quotes with second-accurate pricing on major US exchanges.
No-code workflow
The Function Generator turns every SheetsFinance market-data function into guided controls. Choose a symbol, dataset, metrics, reporting period and options, then generate a ready-to-use formula for Google Sheets or Excel.
Also in the sidebar
Filter 87,000+ assets using hundreds of market and fundamental metrics.
Find companies, funds, crypto, forex pairs and other instruments by name or ticker.
Start with a ready-made analysis, then customize it with formulas generated for you.
Everything you need for research and analysis
From live quotes to three decades of fundamentals, all through simple spreadsheet functions.
Global reach
Access global equities, ETFs and exchange-listed instruments through the same spreadsheet formulas - from the NASDAQ and ASX to Tokyo, London, Toronto and Hong Kong.
Global indices
S&P 500, FTSE, Nikkei...
Exchange-traded bonds
Corporate & government
6,000+ cryptocurrencies
Spot prices & history
All major FOREX pairs
Live cross rates
Commodities
Metals, energy & ags
ETFs & mutual funds
Holdings & exposure
Looking for a specific exchange? See the full list of available markets in our docs →
Market Data plans
Every plan starts with a 15-day free trial. No payment details required.
Book a 20-minute live demo and we'll build a live watchlist or research dashboard with you.
Testimonials
“Seems to be the most comprehensive real-time data source and at a reasonable price. Offers more bang for the buck and hopefully no missing data like GoogleFinance().”
“This is the best application I have ever found on sheets. I say that completely genuinely. I usually use things on the "it works well enough" basis. This not only works, but it works well. It has an insane amount of options, does everything so quickly, and there's even a function to refresh errors. I have never seen something so well-made on workspace.”
“SheetsFinance has proved to be a great solution for the Portfolio. We track about 300 stocks globally so that means a lot of different markets and need a lot of relevant data beyond price and PE. SheetsFinance provides all of this and the company offers super friendly, efficient and helpful support with using the product and integrating it into Google Sheets - even helping with formula and syntax suggestions. … An excellent solution. The different tier of plans make this very affordable.”
“Just installed to test out the data I wanted (price, dividend, analyst price estimates, specific option quotes). Works like a charm, I highly recommend you try it out for your needs!”
“Gives you all the finance items that google finance doesn't have. At this price, its a steal! If you do any stock analysis using google sheets, Just get it.”
Frequently asked questions