Time series
30+ years of historical daily and intra/inter-day price data for all our assets can be generated using the uber powerful SF_TIMESERIES(). This function will return multiple rows of data depending on the time series range or period specified. This functions layout is as follows:
=SF_TIMESERIES(symbol, startDate, endDate, period, metric, options)symbolis either the location of the cell containing the stock or coin ticker symbol or of course the stock/coin ticker symbol itself. (e.g.A1or"AAPL")startDateis the starting date of the time series, written in iso format YYY-MM-DD, e.g."2000-04-03"endDateis the ending date of the time series, written in iso format YYY-MM-DD, e.g."2019-12-24"periodspecifies the period for an intra/inter-day time series (e.g. 5 minute intervals,"5min"or 1 week intervals,"1week"). A maximum difference between start and end date is applied for intra-day time series, therefore if an intra-day period is selected and the time-series range is greater than the allowed amount the data will be constrained to the maximum allowed range using theendDateat reference.metricoptional selection of a specific metric, metrics are"date","open","high","low","close","adjClose","volume","unadjustedVolume","change","changePercent"and"vwap". [NOTE:"adjClose","unadjustedVolume","change","changePercent"and"vwap"are not available for intra-day time series]. Metrics can be chained together to filter the data down to what you would like, e.g.,"date&close&volume".optionsformat options for the output. Three options are available: output order, header/no header, and"extended"for pre-market and post-market data on intra-day periods. Results are returned latest first by default. Use"-"to reverse the order so the oldest date comes first, and"NH"to remove the header row. Combine them with &, e.g."-&NH".
Tips:
This function will not display if there is data in any of the cells it wants to occupy. You will receive a
#REF!or#SPILL!error "Array result was not expanded because it would overwrite data in XX".Use Google Sheet's in-built
TODAY()function to generate a time-series relative to today's date.Set the period to
"dailyAdj"to get a daily dividend adjusted time-series.Intra-day time-series are constrained to a maximum range of dates depending on the period selected, see below for more details.
changeandchangePercentmetrics are calculated using the Close-Open Method, wherechange = close - openandchangePercent = (close - open) / open * 100. If you would like to calculate Close-Prev Close you will need to do so in an additional manual column.
Daily Time-Series
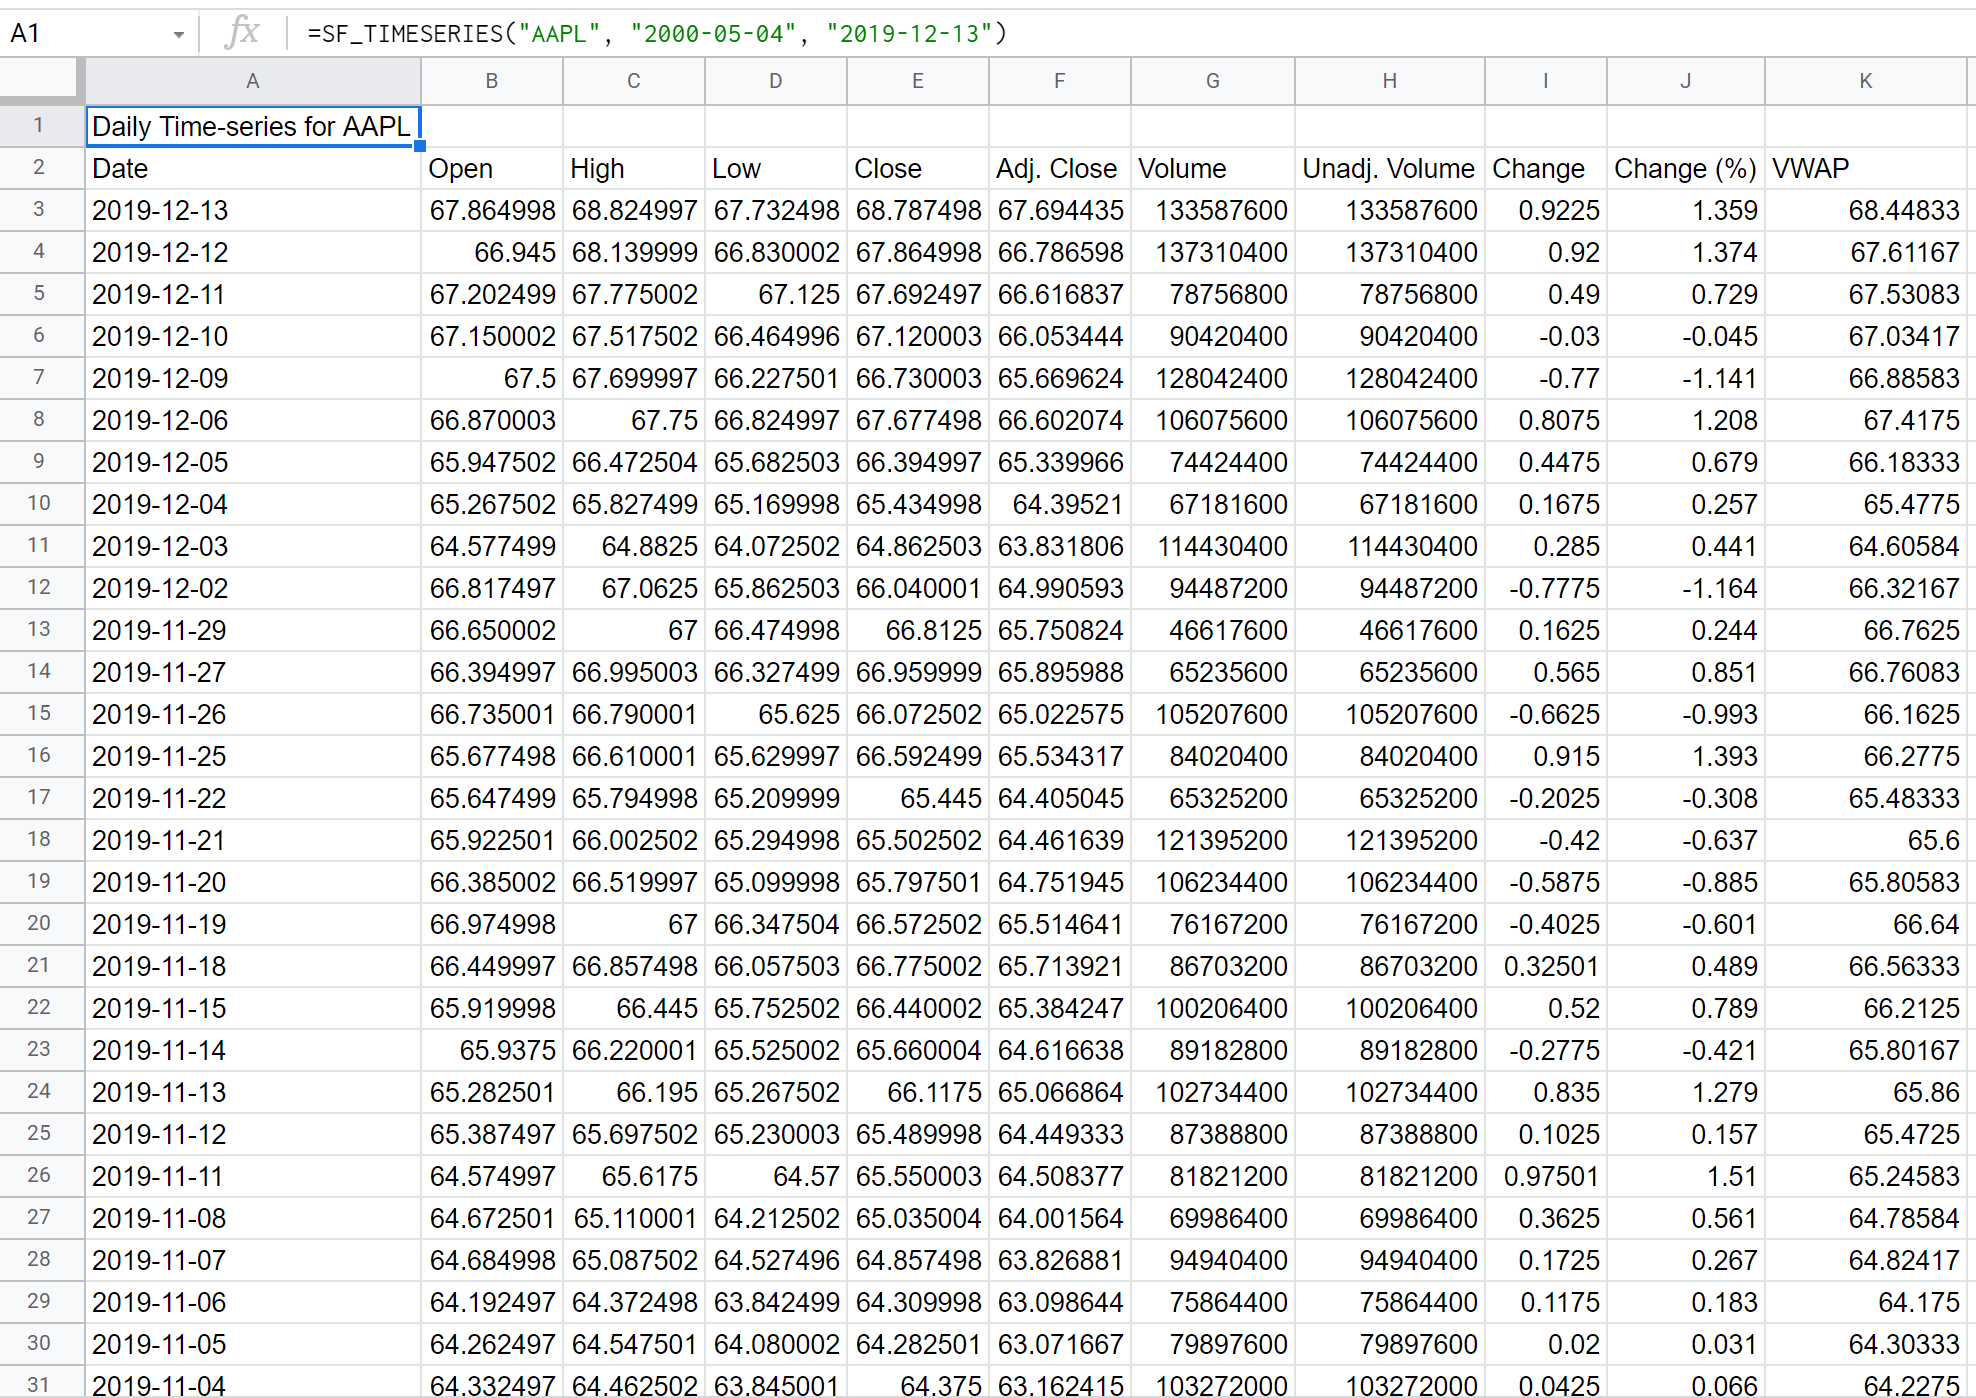
A daily time-series is the historical price performance of an asset on a daily basis between a start and end date. This is the split-adjusted price which can be thought of as the standard chart or OHLCV for the asset. The daily time-series is generated by omitting the period argument, setting it to "" (an empty string) or setting it to "daily". SheetsFinance has 30+ years of daily data available. You can enter the dates directly as a string in YYYY-MM-DD format, reference the dates from other cells formatted as Dates or use in-built functions such as TODAY() to generate a time-series relative to today's date.
=SF_TIMESERIES("AAPL", "2010-05-04", "2023-10-26", "", "all")The daily time series metric options are:
All (
"all")Date (
"date")Open (
"open")High (
"high")Low (
"low")Close (
"close")Adj. Close (
"adjClose")Volume (
"volume")Unadjusted Volume (
"unadjustedVolume")Change (
"change") - Close-Open Method (change = close - open)Change (%) (
"changePercent") - Close-Open Method (changePercent = (close - open) / open * 100)Change Over Time (
"changeOverTime")VWAP (
"vwap")
Daily Dividend Adjusted Time-Series
A daily dividend adjusted time-series is the historical price performance of an asset on a daily basis between a start and end date including dividend adjustments. This can also be thought of as the adjusted chart or adjusted OHLCV for the asset. The daily dividend adjusted time-series is generated by setting the period argument to "dailyAdj". SheetsFinance has 30+ years of daily data available. You can enter the dates directly as a string in YYYY-MM-DD format, reference the dates from other cells formatted as Dates or use in-built functions such as TODAY() to generate a time-series relative to today's date.
=SF_TIMESERIES("AAPL", "2010-05-04", "2023-10-26", "dailyAdj", "all")The daily dividend adjusted time series metric options are:
All (
"all")Date (
"date")Adj. Open (
"adjOpen")Adj. High (
"adjHigh")Adj. Low (
"adjLow")Adj. Close (
"adjClose")Volume (
"volume")
Intra-day & Inter-day Time-Series
An intra-day time series is the historical price performance of an asset at intervals less than one day. Whilst an inter-day time-series covers intervals greater than one day (e.g., one week or one month). Intra/inter-day time series are generated by setting the period argument to the desired interval, e.g., "1min" for 1 minute intervals.
=SF_TIMESERIES("AAPL", "2023-02-01", "2023-02-25", "1hour", "all")The intra-day time series metric options are:
All (
"all")Date (with time) (
"date")Open (
"open")High (
"high")Low (
"low")Close (
"close")Volume (
"volume")
The intra/inter-day time series uses the period parameter to specify the intervals, the options are:
1 minute (
"1min")5 minutes (
"5min")15 minutes (
"15min")30 minutes (
"30min")1 hour (
"1hour")4 hour (
"4hour")1 week (
"1week")1 month (
"1month")1 year (
"1year")
Intra-day time series are constrained to a maximum range of dates depending on the period selected. In the case that the range is larger than the maximum the output will be constrained to the maximum range using the endDate as the reference (i.e. startDate will be ignored and the endDate will be the last entry of the output). There are no limits for inter-day time-series.
The intra-day time series maximum date ranges are:
1 minute (
"1min") - 2 trading days (3 calendar days)5 minutes (
"5min") - 7 trading days (10 calendar days)15 minutes (
"15min") - ~45 calendar days (~6 weeks)30 minutes (
"30min") - 30 calendar days1 hour (
"1hour") - ~88 calendar days4 hour (
"4hour") - ~180 calendar days
To pull more data than a single call allows, stack multiple date-range calls into one output with VSTACK. See Stack limited date ranges with VSTACK.
Add "extended" to the options argument to include pre-market and post-market prices. It is available only for the six intra-day intervals ("1min", "5min", "15min", "30min", "1hour", "4hour") and combines with the other options, for example "extended&NH&-". Daily and other non-intra-day periods do not offer extended-hours data.
Examples
Example 1 - Daily time series ALL metrics
=SF_TIMESERIES("AAPL", "2017-01-01", "2023-10-25")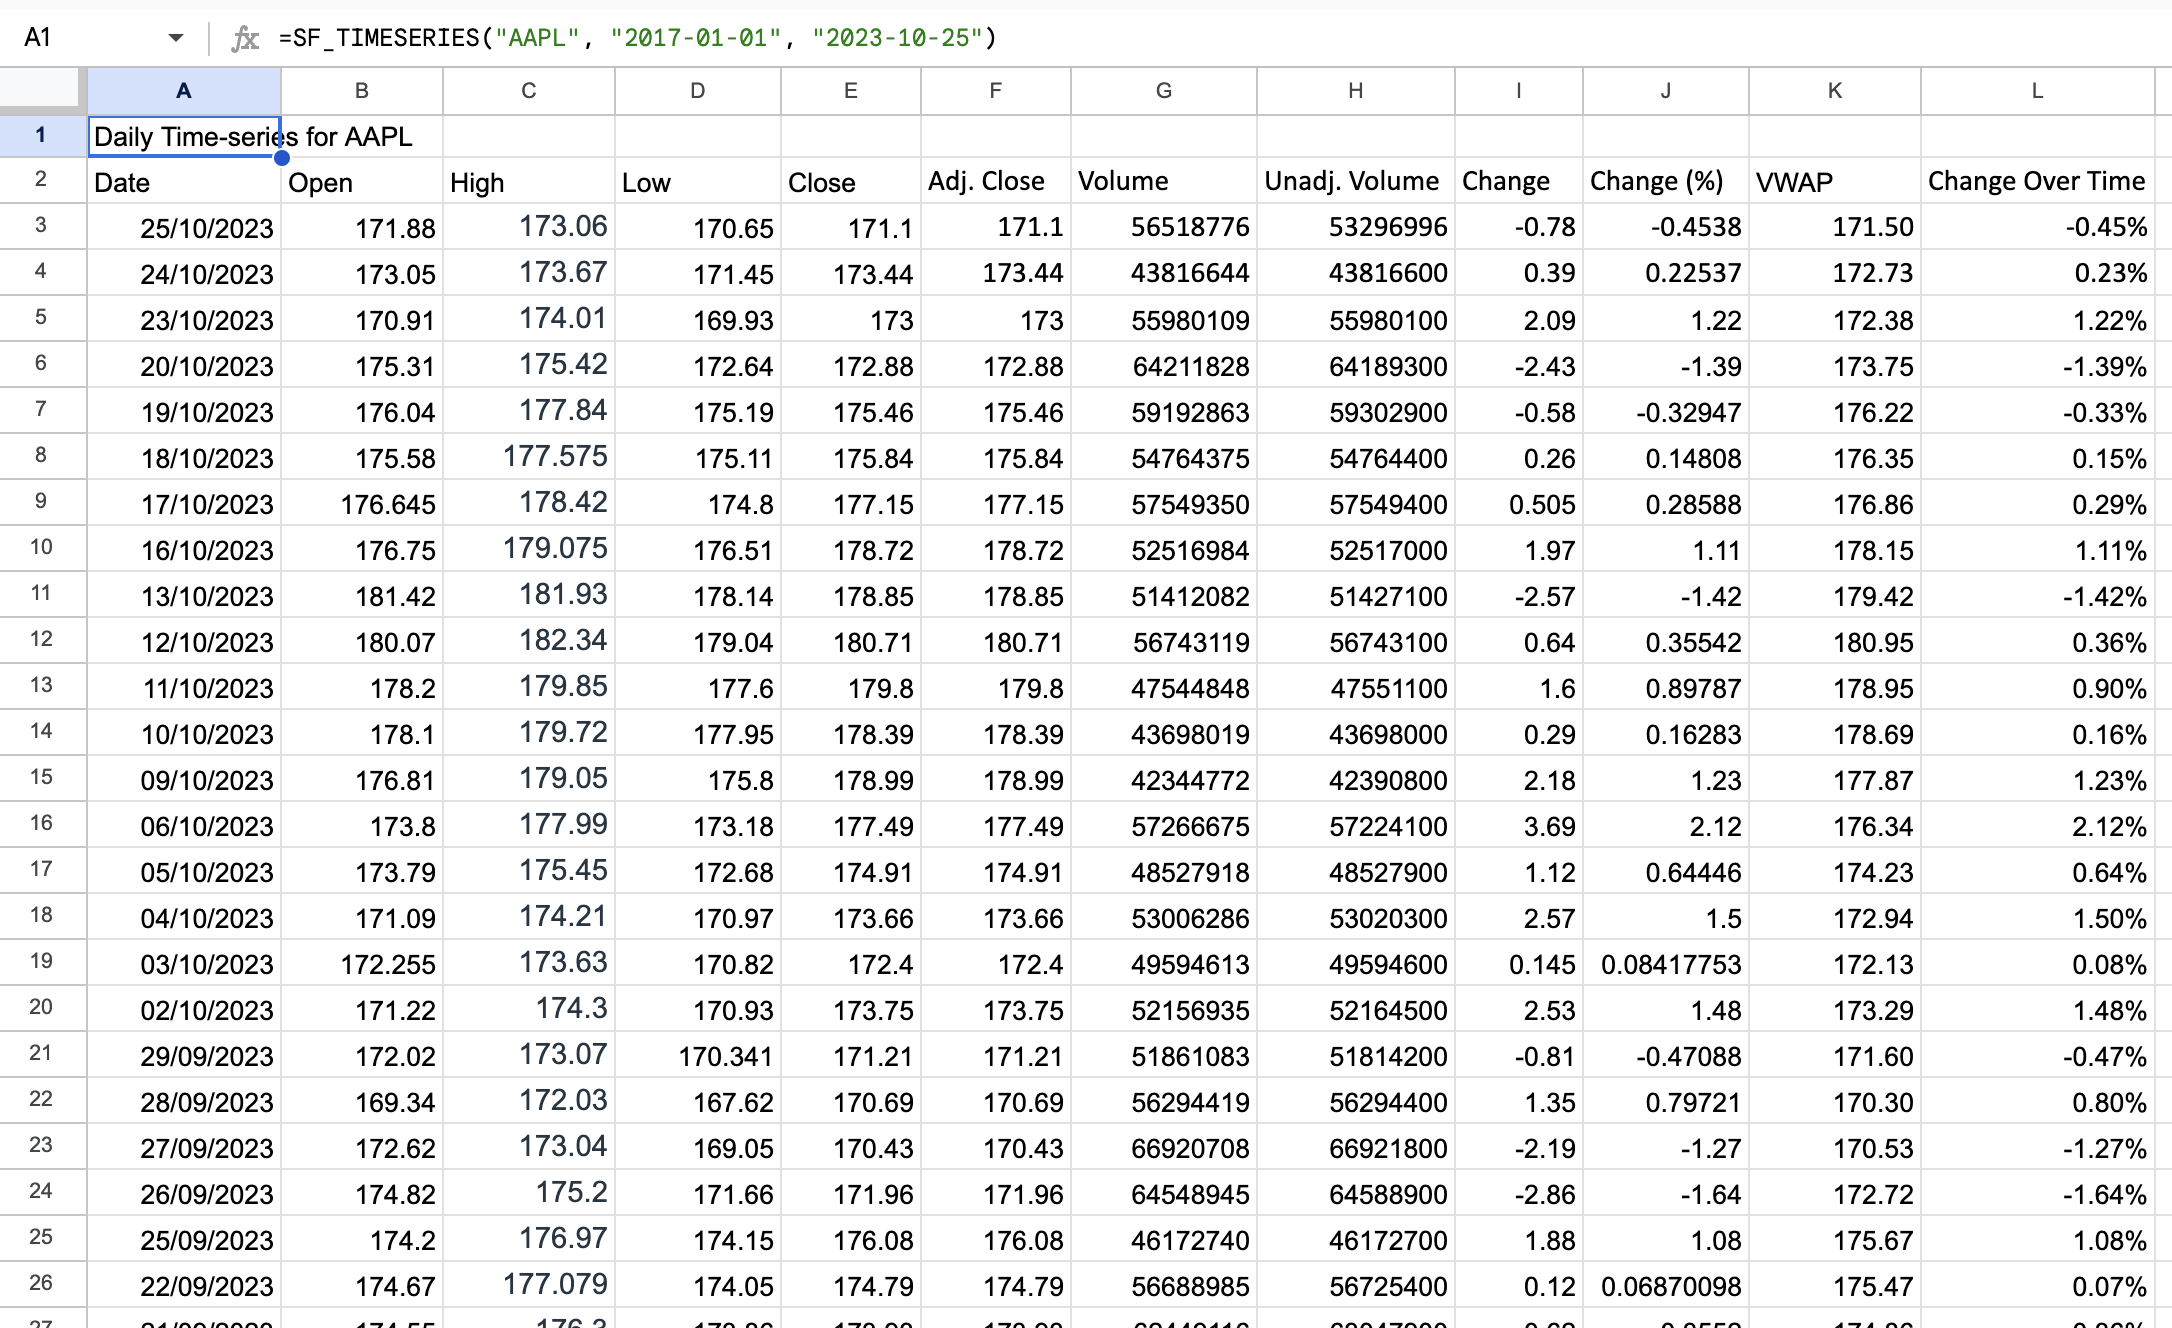
Example 2 - Daily time series specific metrics, last year from today
=SF_TIMESERIES("AAPL", TODAY()-365, TODAY(), "", "date&open&close&volume")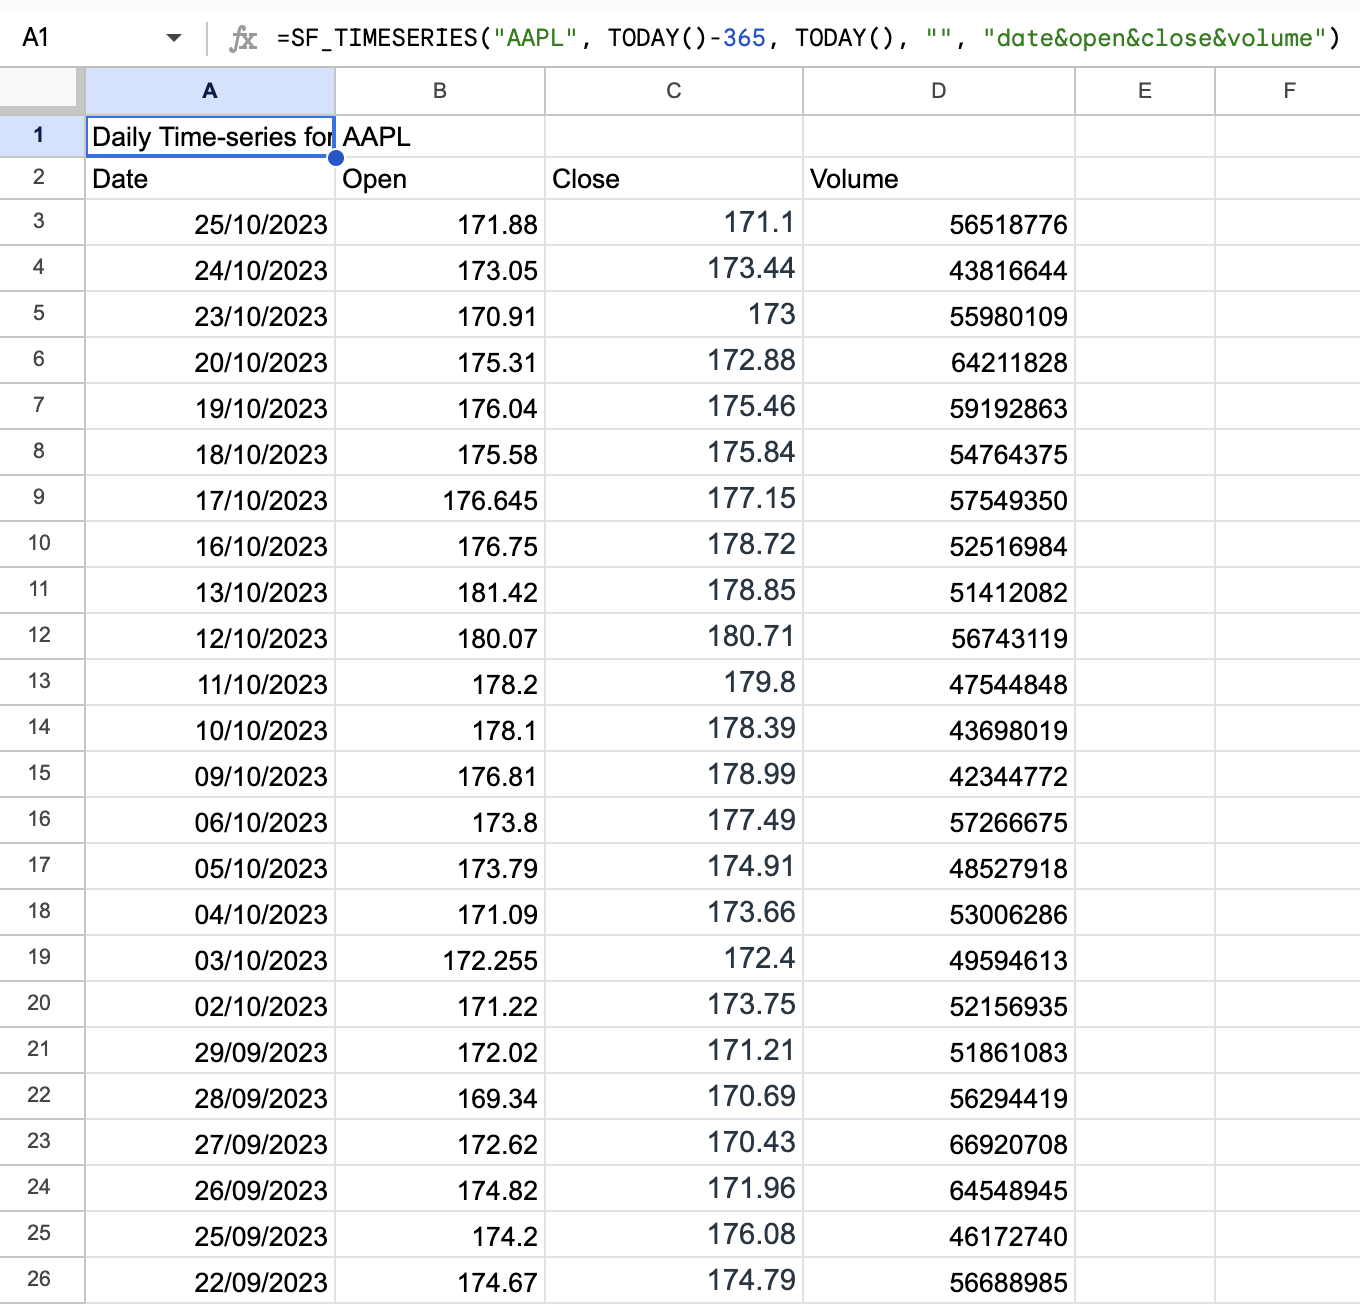
Example 3 - Daily time series specific metrics and options (no header and reversed)
=SF_TIMESERIES("AAPL", "2017-01-01", "2023-10-25", "", "date&open&close&volume", "-&NH")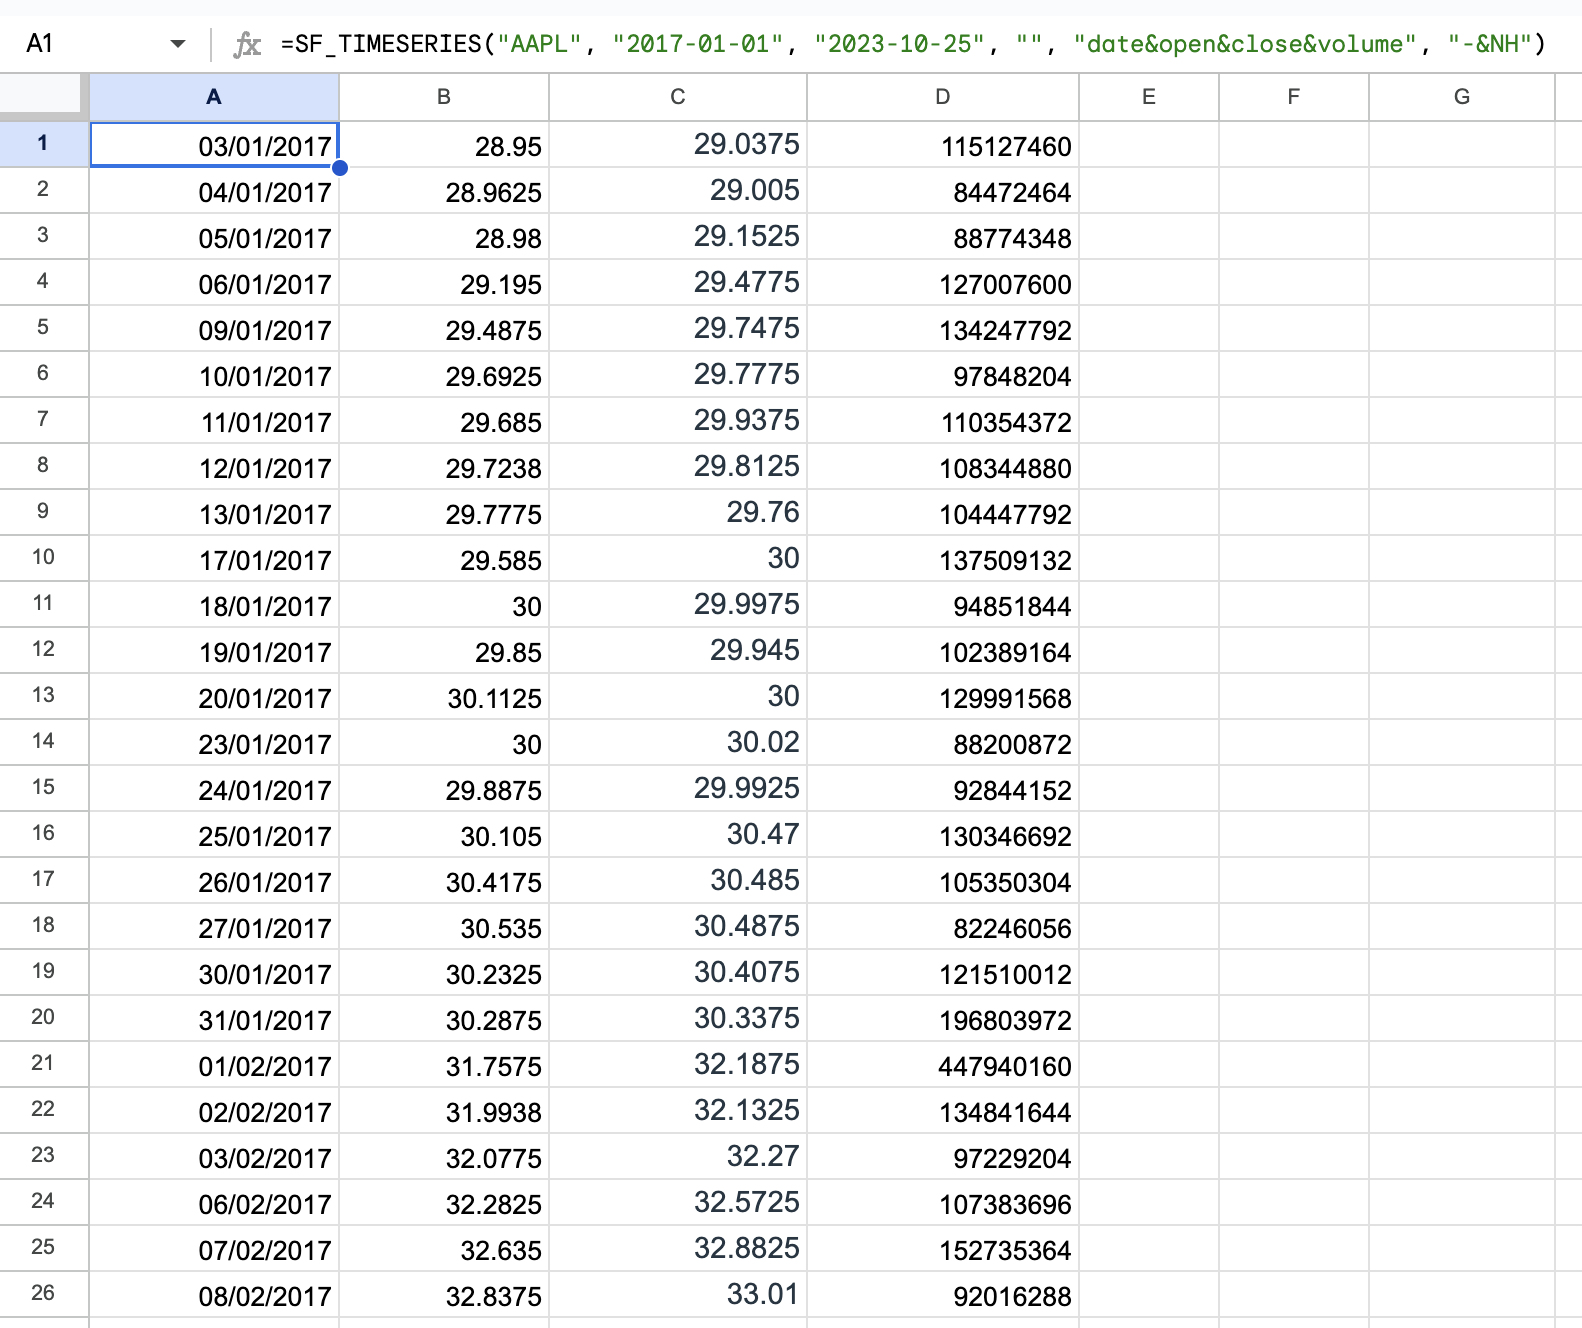
Example 4 - Intra-day 1 min time series ALL metrics, last 3 days
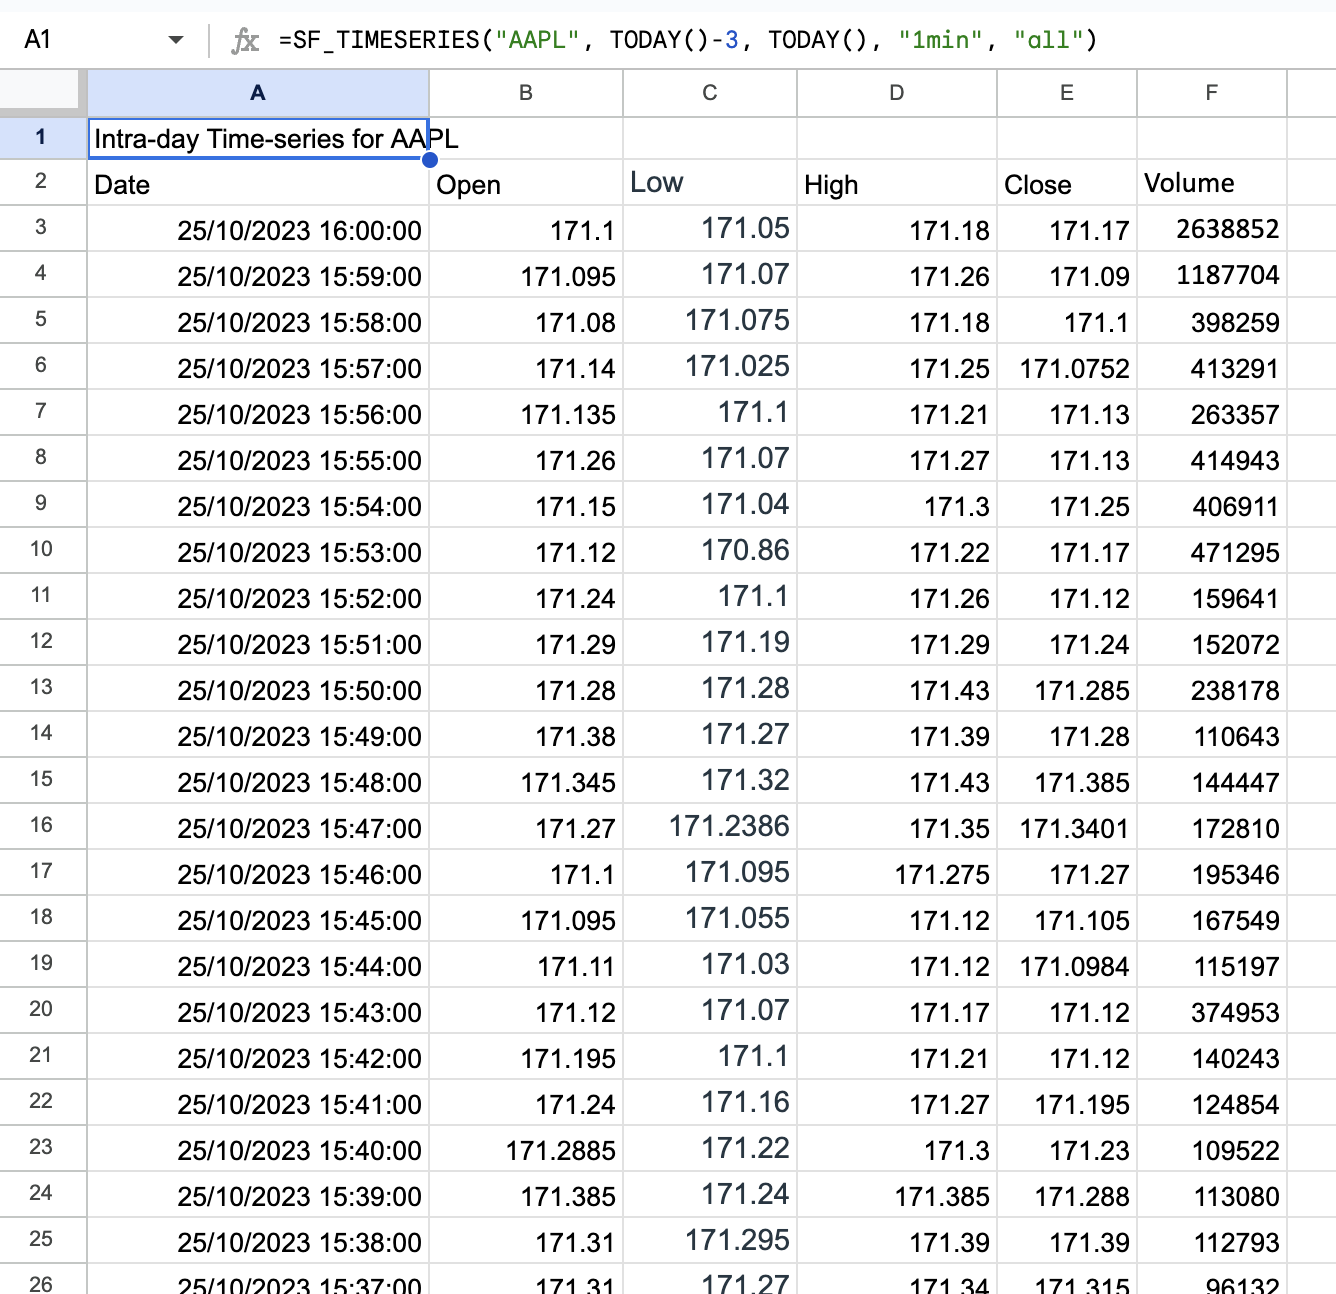
=SF_TIMESERIES("AAPL", TODAY()-3, TODAY(), "1min", "all")Example 5 - Intra-day 1 hour time series specific metrics
=SF_TIMESERIES("AAPL", "2023-01-01", "2023-03-01", "1hour", "date&open&close&volume")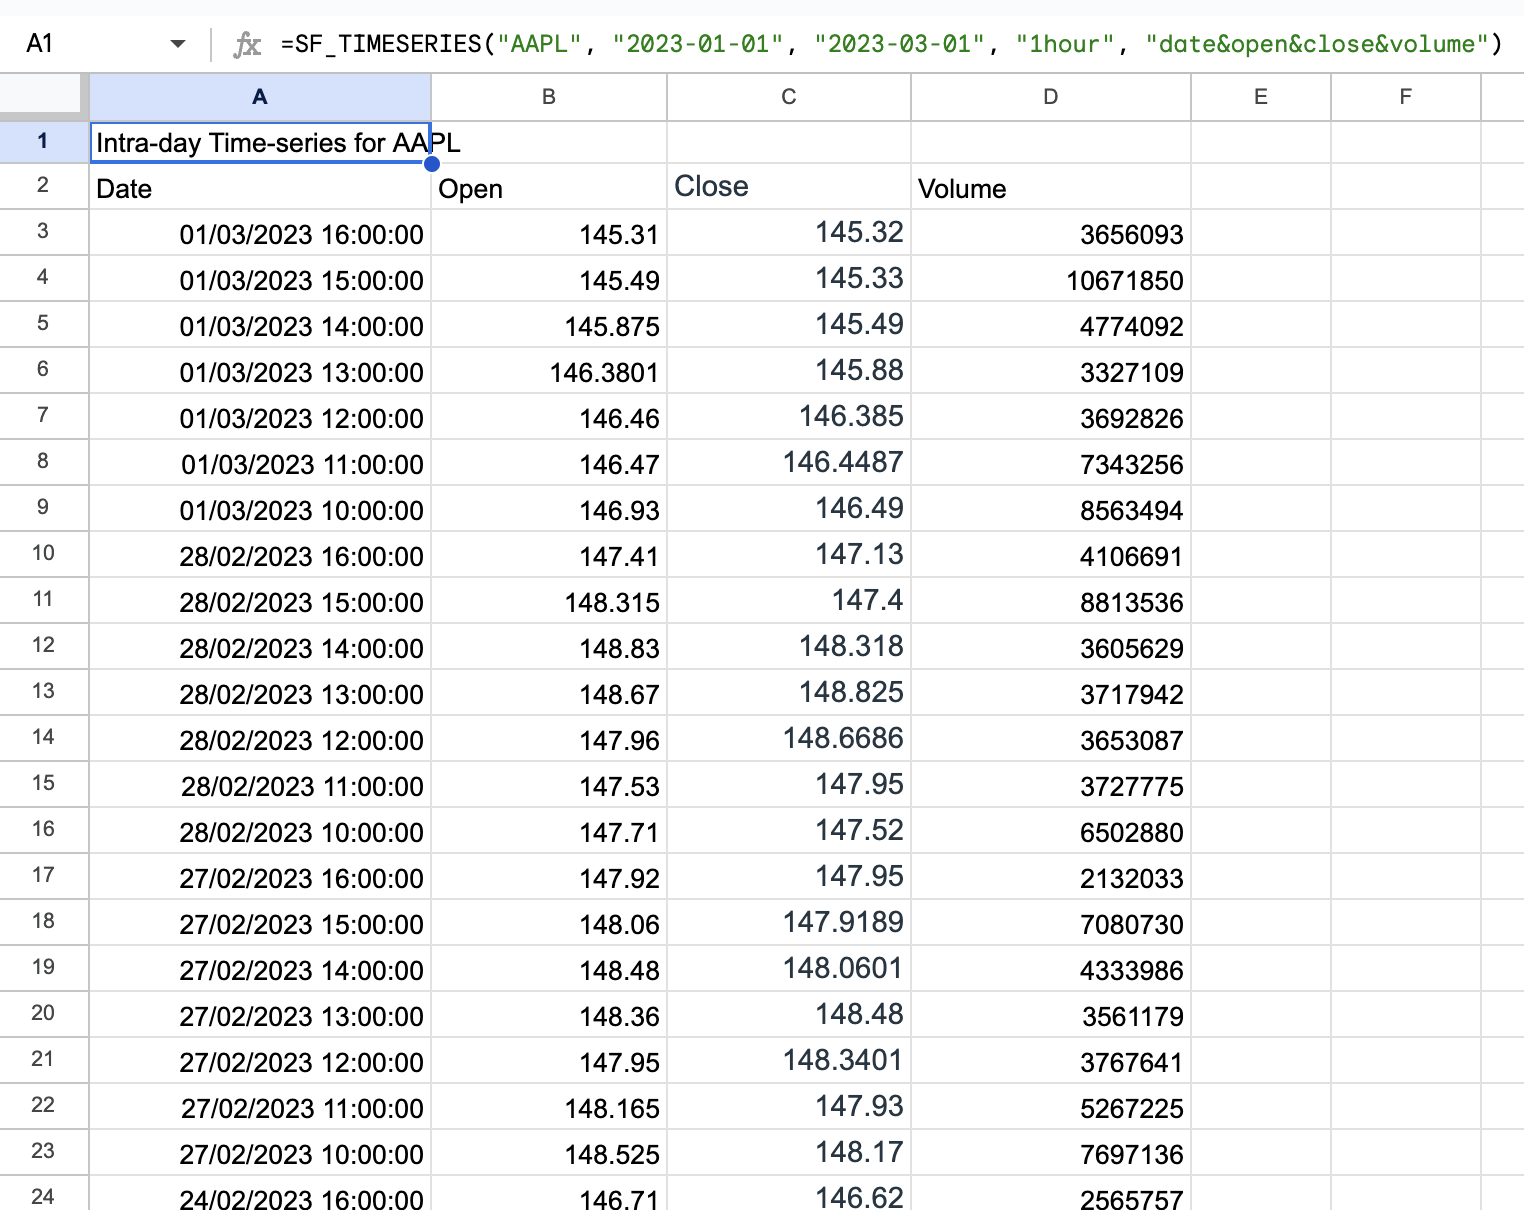
Example 6 - Intra-day 5 min time series specific metrics and options (no header and reversed), last 2 weeks
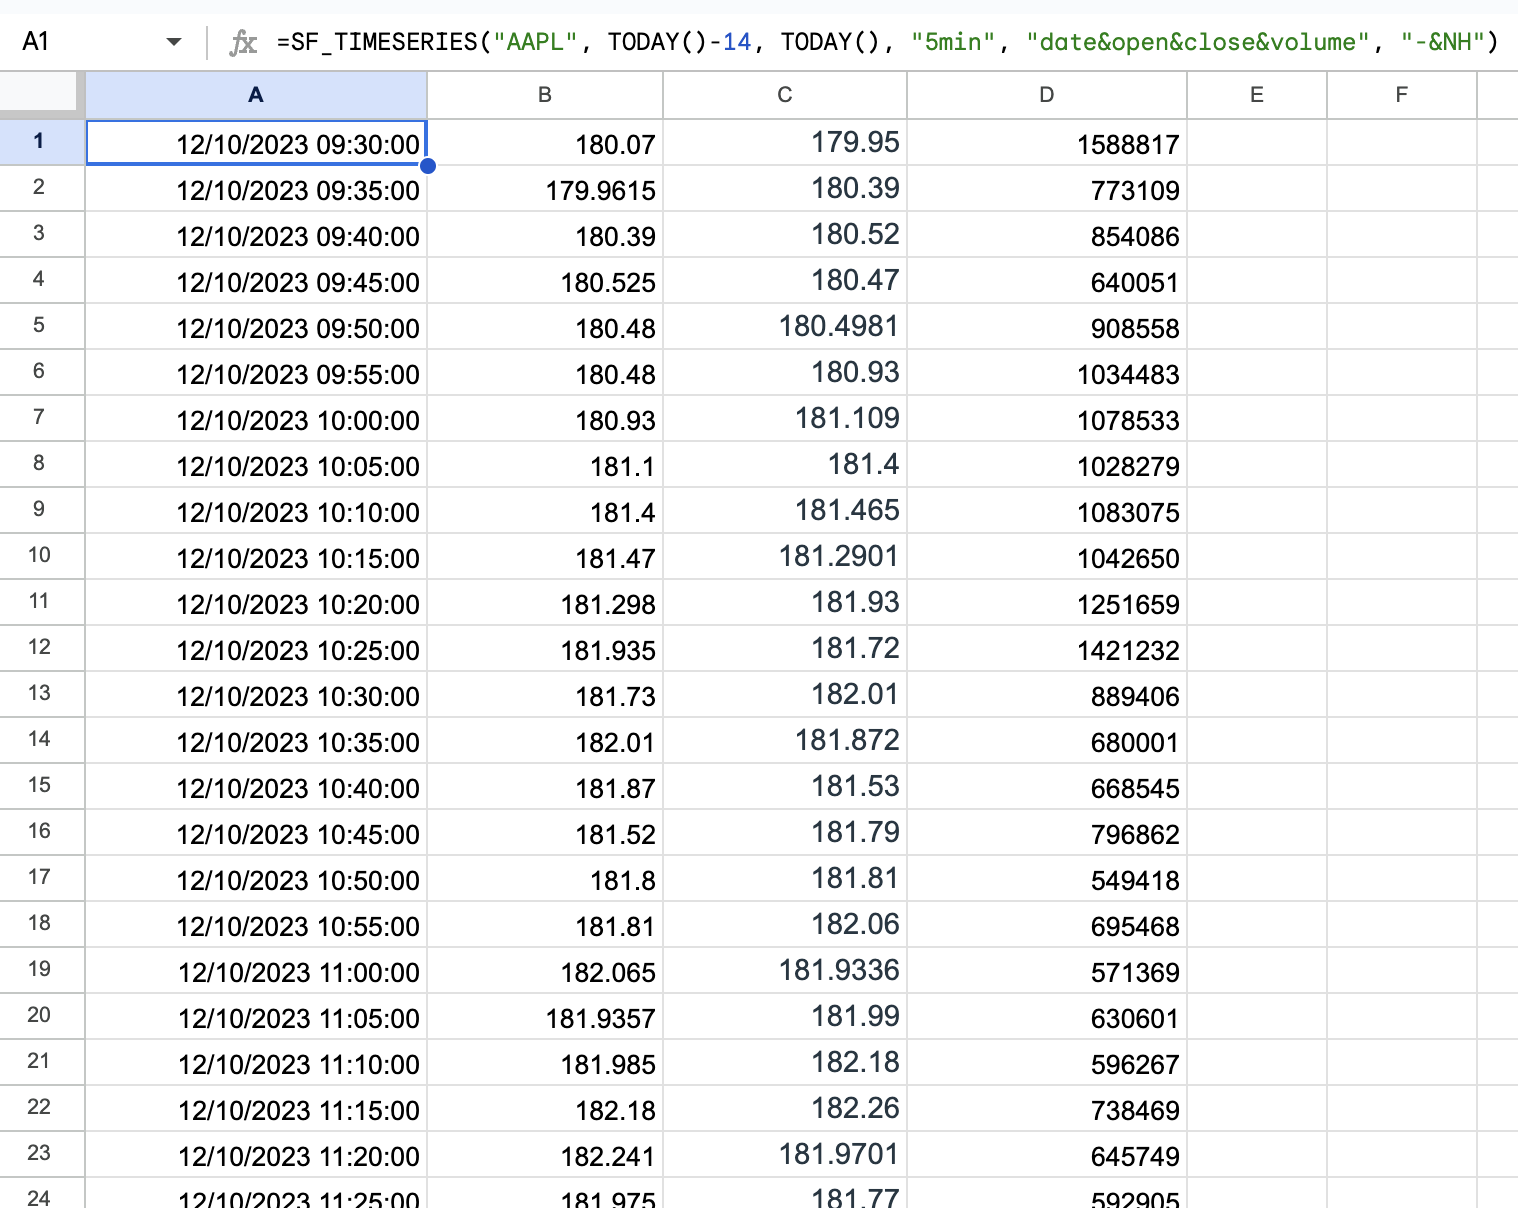
=SF_TIMESERIES("AAPL", TODAY()-14, TODAY(), "5min", "date&open&close&volume", "-&NH")