Price Targets
🇺🇸 Important: Price target data is only available for US markets
The priceTargets data type returns up-to-date and historical analyst price target data for stocks for the last year.
=SF(symbol, "priceTargets", metric, lastXmonths|date, options)symbolis the ticker symbol of the financial asset (e.g.,"AAPL"). You can use our Symbol Search to find the correct ticker symbol.metricselects what metrics to display (see options below), display all metrics by leaving blank or using"all". Chain together as many metrics as you'd like using&, e.g.,"publishedDate&priceTarget".lastXmonths|dateallows you to reduce the dataset down to the last X months of price target data by entering an integer value such as4or a string containing only an integer such as"8". Alternatively, you can enter a year (YYYY), year and month (YYYY-MM) or a specific date (YYYY-MM-DD). If this field is omitted the function will return all available price target data for the last 12 months.optionsadjusts the formatting of the output. There are currently two available options. Set this field to"NH"for no header row and to"-"for reversing the date order of the output data. These options can be chained together with the&operator, for example"NH&-".
The price targets metric options are:
All (
"all")Published Date (
"publishedDate")Analyst Company (
"analystCompany")Analyst Name (
"analystName")Price Target (
"priceTarget")Price When Posted (
"priceWhenPosted")
Examples
Example 1 - Display all price target metrics for the last 6 months
=SF("AAPL", "priceTargets", "all", 6)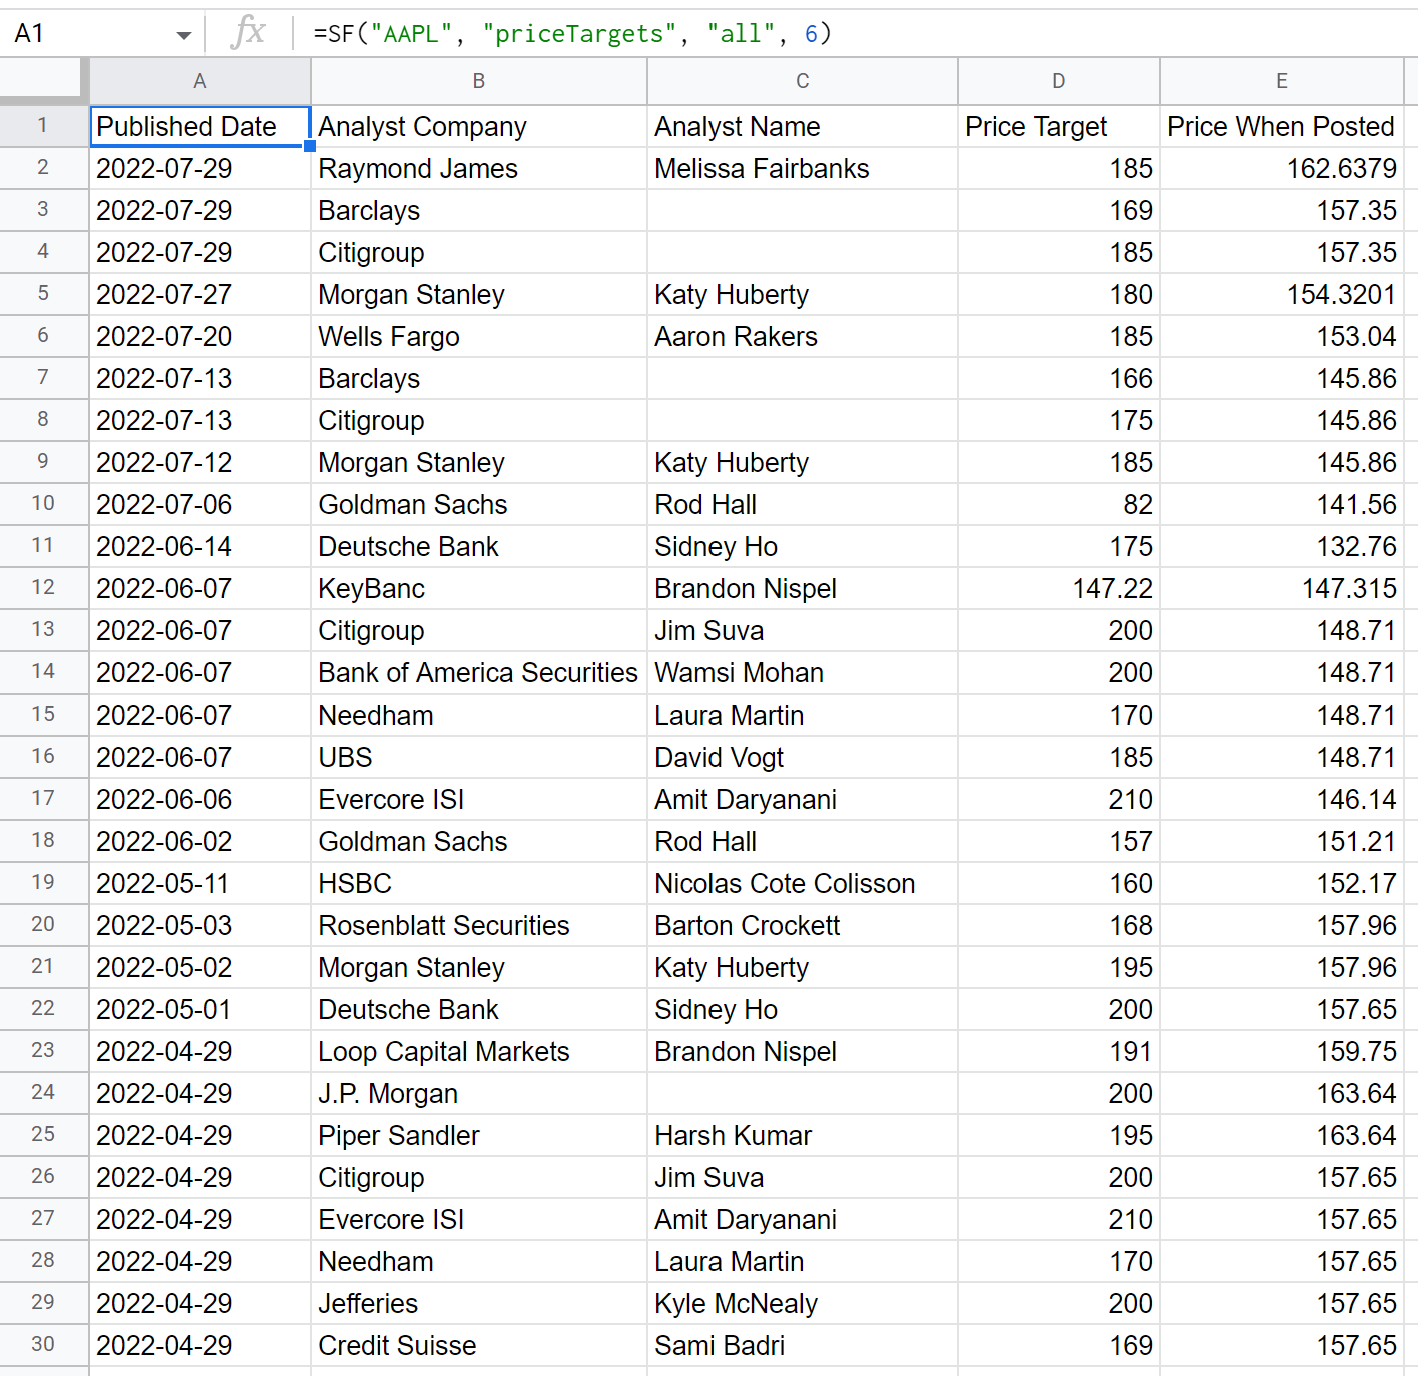
Example 2 - Display several selected metrics, all available months, no options
=SF("AAPL", "priceTargets", "publishedDate&analystCompany&priceTarget")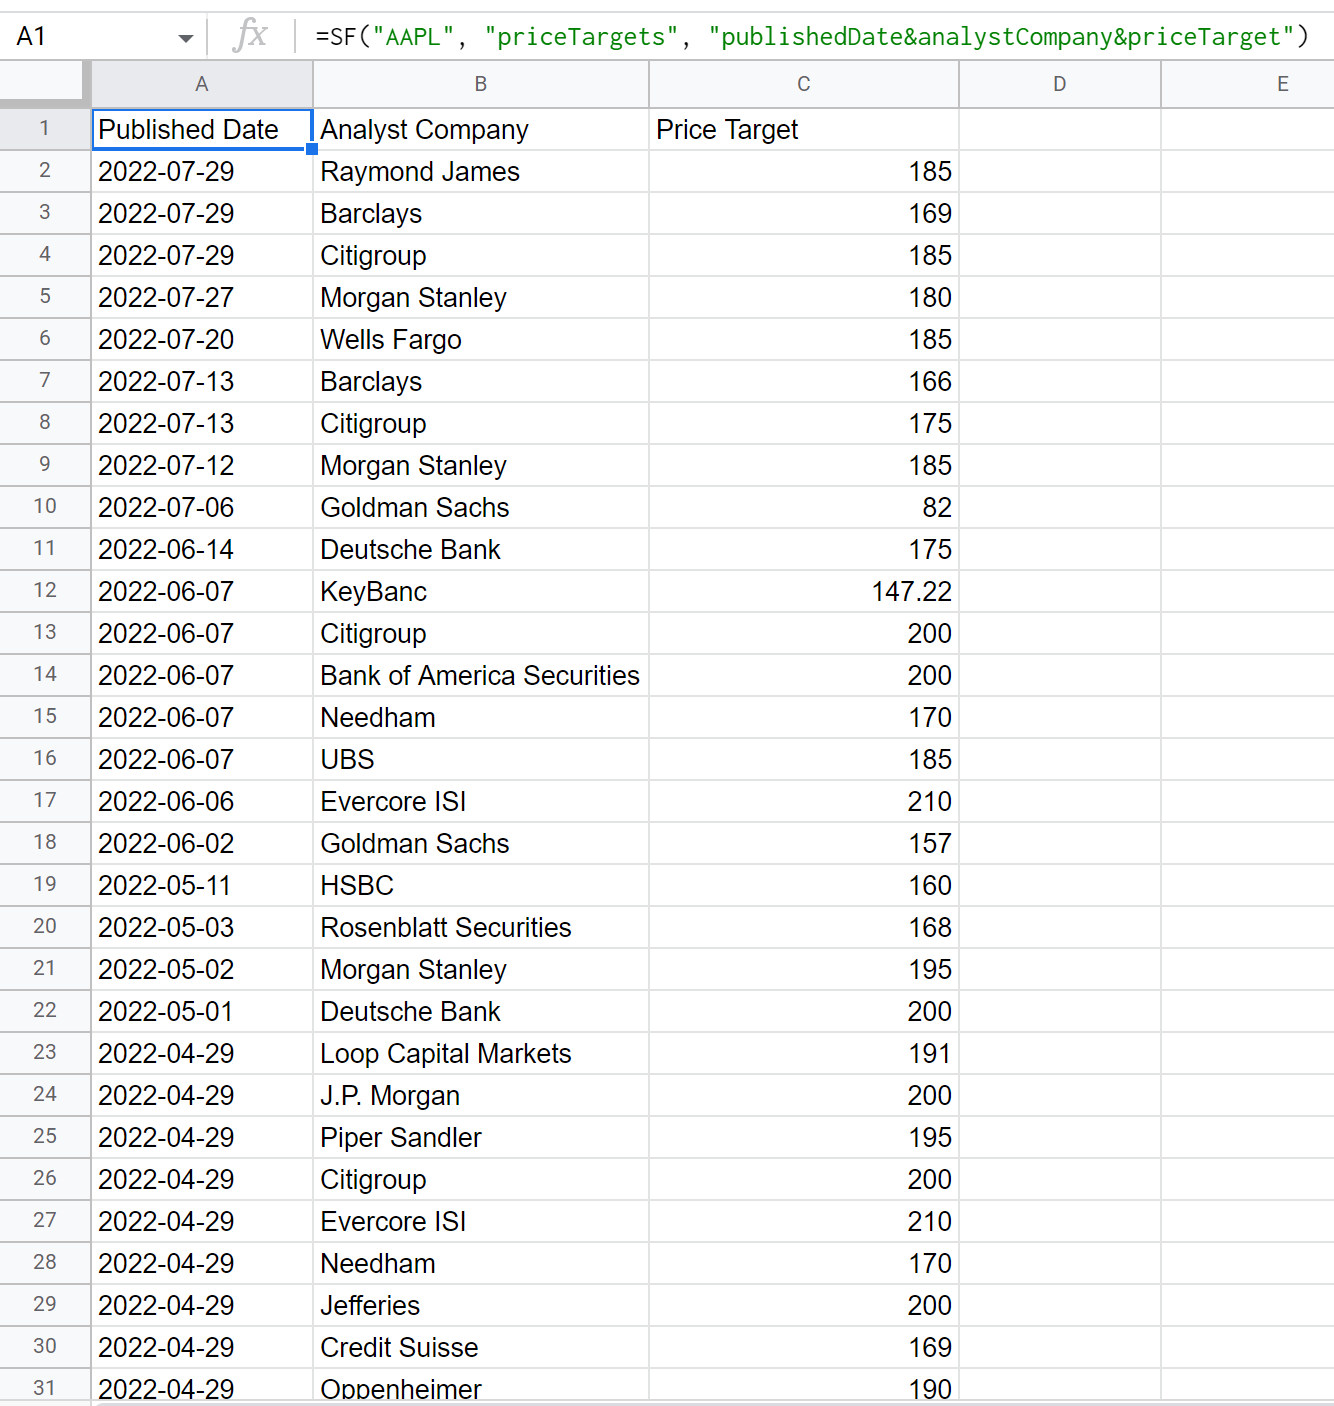
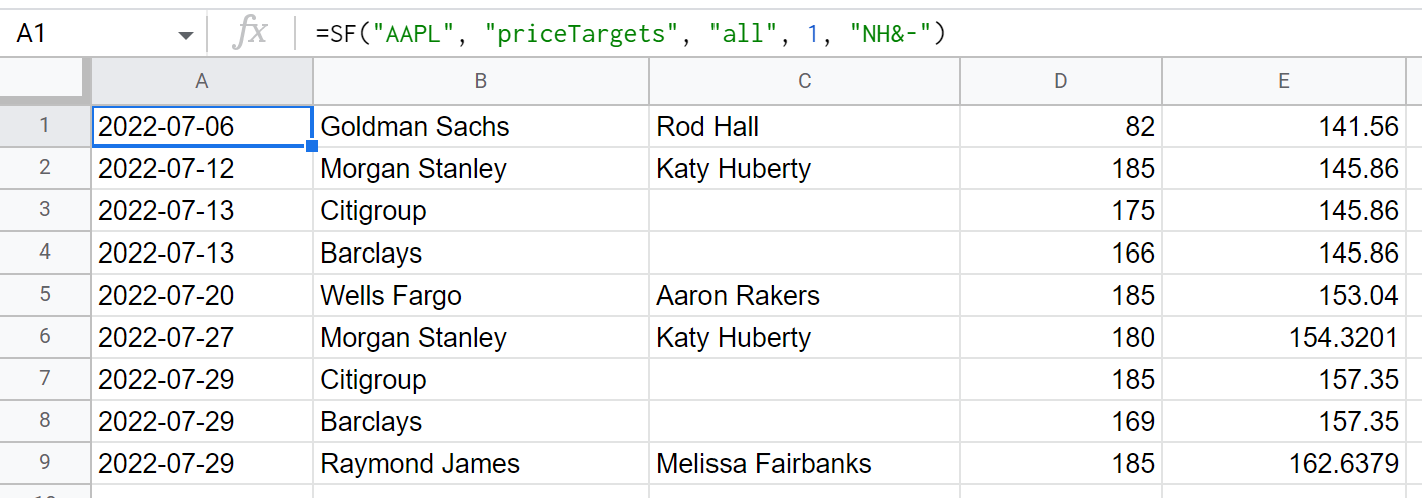
Example 3 - Display all metrics for the last month with options selected (no header and reversed)
=SF("AAPL", "priceTargets", "all", 1, "NH&-")