Sparklines
Important: Sparklines are designed for use with Google Sheets not Excel.
A Google Sheets sparkline of historical stock or coin price or volume can be generated with the help of SF_SPARK(). This function is to be used in conjunction with Google Sheet's built-in sparklines function (SPARKLINE()). This functions layout is as follows:
=SF_SPARK(tickerCell, lastXdays, type)tickerCellis the either the location of the cell containing the stock or coin ticker code or of course the stock/coin ticker code itself. (e.g.A1or"AAPL")lastXdaysis a ninteger value to specify the number of days to display the price sparkline over (e.g."365"will display the price performance of the last year)typeis either"price"(or left empty) to return a price sparkline or"volume"for a volume bar chart sparkline.
SF_SPARK returns an 1D array of close prices or total volume per day for the number of days specificed in the lastXdays parameter. If the function is not nested within Google Sheet's built-in sparklines function (SPARKLINE()) it will consume as many rows as the length of the return array. If nested within SPARKLINE() it will consume only the single cell in which the formula is executed.
Tip: It is much easier to generate a sparkline with the help of our Function Generator.
Examples
Price Sparkline
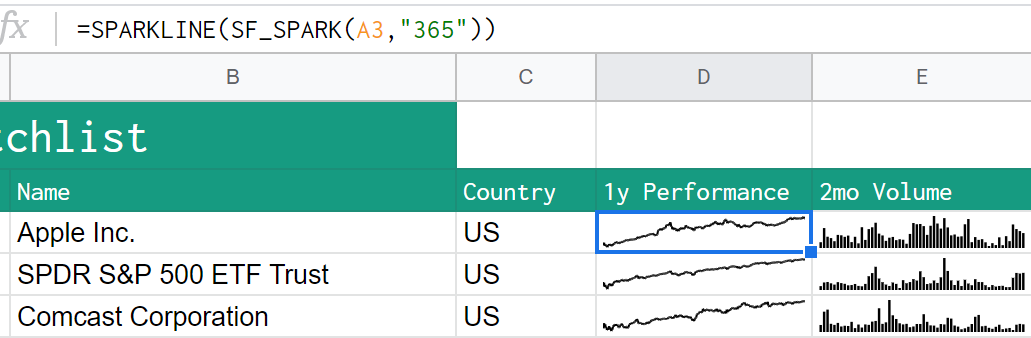
=SPARKLINE(SF_SPARK("AAPL", "365"))Specifying "365" days returns the last year of price performance.
Volume Sparkline
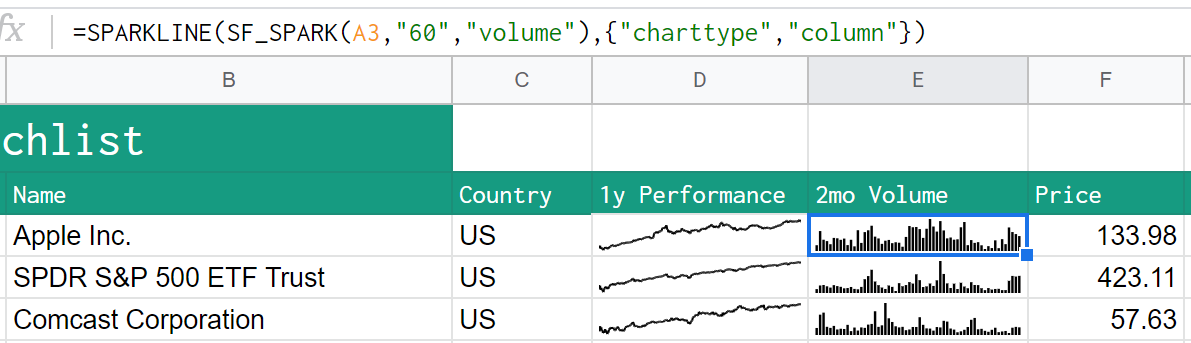
=SPARKLINE(SF_SPARK("AAPL","60","volume"),{"charttype","column"})Specifying "60" days returns the last 2 months of volume performance.