Technical Analysis
Technical analysis is achieved using the SF_TECHNICAL() function. The function allows for the generation of a specified technical analysis layered over the historical price data of a stock, crypto or ETF. You are able to define a timeframe and apply the analysis with a specific period of that timeframe. For example, a 20-day SMA with daily data or a 20-minute SMA with minute-by-minute intra-day data.
=SF_TECHNICAL(symbol, type, timeframe, startDate, endDate, options)symbolis the ticker symbol of the financial asset (e.g.,"AAPL"). You can use our Symbol Search to find the correct ticker symbol.typecombines a positive period followed by the indicator, with optional display fields appended using the&operator. For example,20smais a Simple Moving Average (SMA) applied over 20 periods,50emais an Exponential Moving Average (EMA) applied over 50 periods, and14rsiis an RSI applied over 14 periods. Some examples are"20sma&all","50ema&date&close"and"100williams&date&high&low".timeframedefines the candle/bin/granularity size, for example"daily","1min"or"30min". All timeframe options are outlined below.startDateis the starting date of the time series, written in ISO formatYYYY-MM-DD, e.g."2000-04-03"endDateis the ending date of the time series, written in ISO formatYYYY-MM-DD, e.g."2019-12-24"optionsadjusts the formatting of the output. There are two available options:"NH"for no header row and"-"to reverse the output order. You can combine options with the&operator, for example"NH&-".
Important: See how to use the type parameter correctly below for a more detailed explanation on how to construct the type correctly.
The analysis options for type are:
Simple Moving Average (
"sma")Exponential Moving Average (
"ema")Weighted Moving Average (
"wma")Double Exponential Moving Average (
"dema")Triple Exponential Moving Average (
"tema")Williams %R (
"williams")Relative Strength Index Indicator (
"rsi")Average Directional Index (
"adx")Standard Deviation (
"standardDeviation")
The additional display options for type are:
All (
"all")Date (
"date")Open (
"open")High (
"high")Low (
"low")Close (
"close")Volume (
"volume")
The timeframe options are:
Daily (
"daily")1 minute (
"1min")5 minutes (
"5min")15 minutes (
"15min")30 minutes (
"30min")1 hour (
"1hour")4 hour (
"4hour")
How to use the type parameter correctly
All the magic happens in the type parameter of the SF_TECHNICAL() function. There are three key parts to it:
Period
Analysis type
Additional display items
These three items are combined as follows:
[Period][Analysis type]&[Additional display 1]&[Additional display item 2]...For example if you want a Simple Moving Average (SMA) applied over 20 periods and you'd like to generate the time-series alongside the date and close price then your type parameter would be as follows:
20sma&date&closeIf you want an Exponential Moving Average (EMA) applied over 100 periods and you'd like to generate all available display items then your type parameter would be as follows:
100ema&allHow output columns are ordered
The indicator always comes after the display fields you explicitly request, and date is only included when you ask for it.
type | Columns returned |
|---|---|
| RSI only, in column 1 |
| Date, then RSI |
| Date, Close, then RSI |
| All supported display fields (Date, Open, High, Low, Close, Volume), then RSI |
The indicator follows the display fields you explicitly request.
Date is not returned unless you request it with
"date"or"all"."NH"removes the header row; the data rows and the columns are unchanged."-"reverses the row order without changing the columns.
Examples
Okay this all sounds a bit complex so here are some really easy examples to get you started.
Example 1 - 20 day SMA with all parameters
=SF_TECHNICAL("AAPL", "20sma&all", "daily", "2022-01-01", "2022-11-26")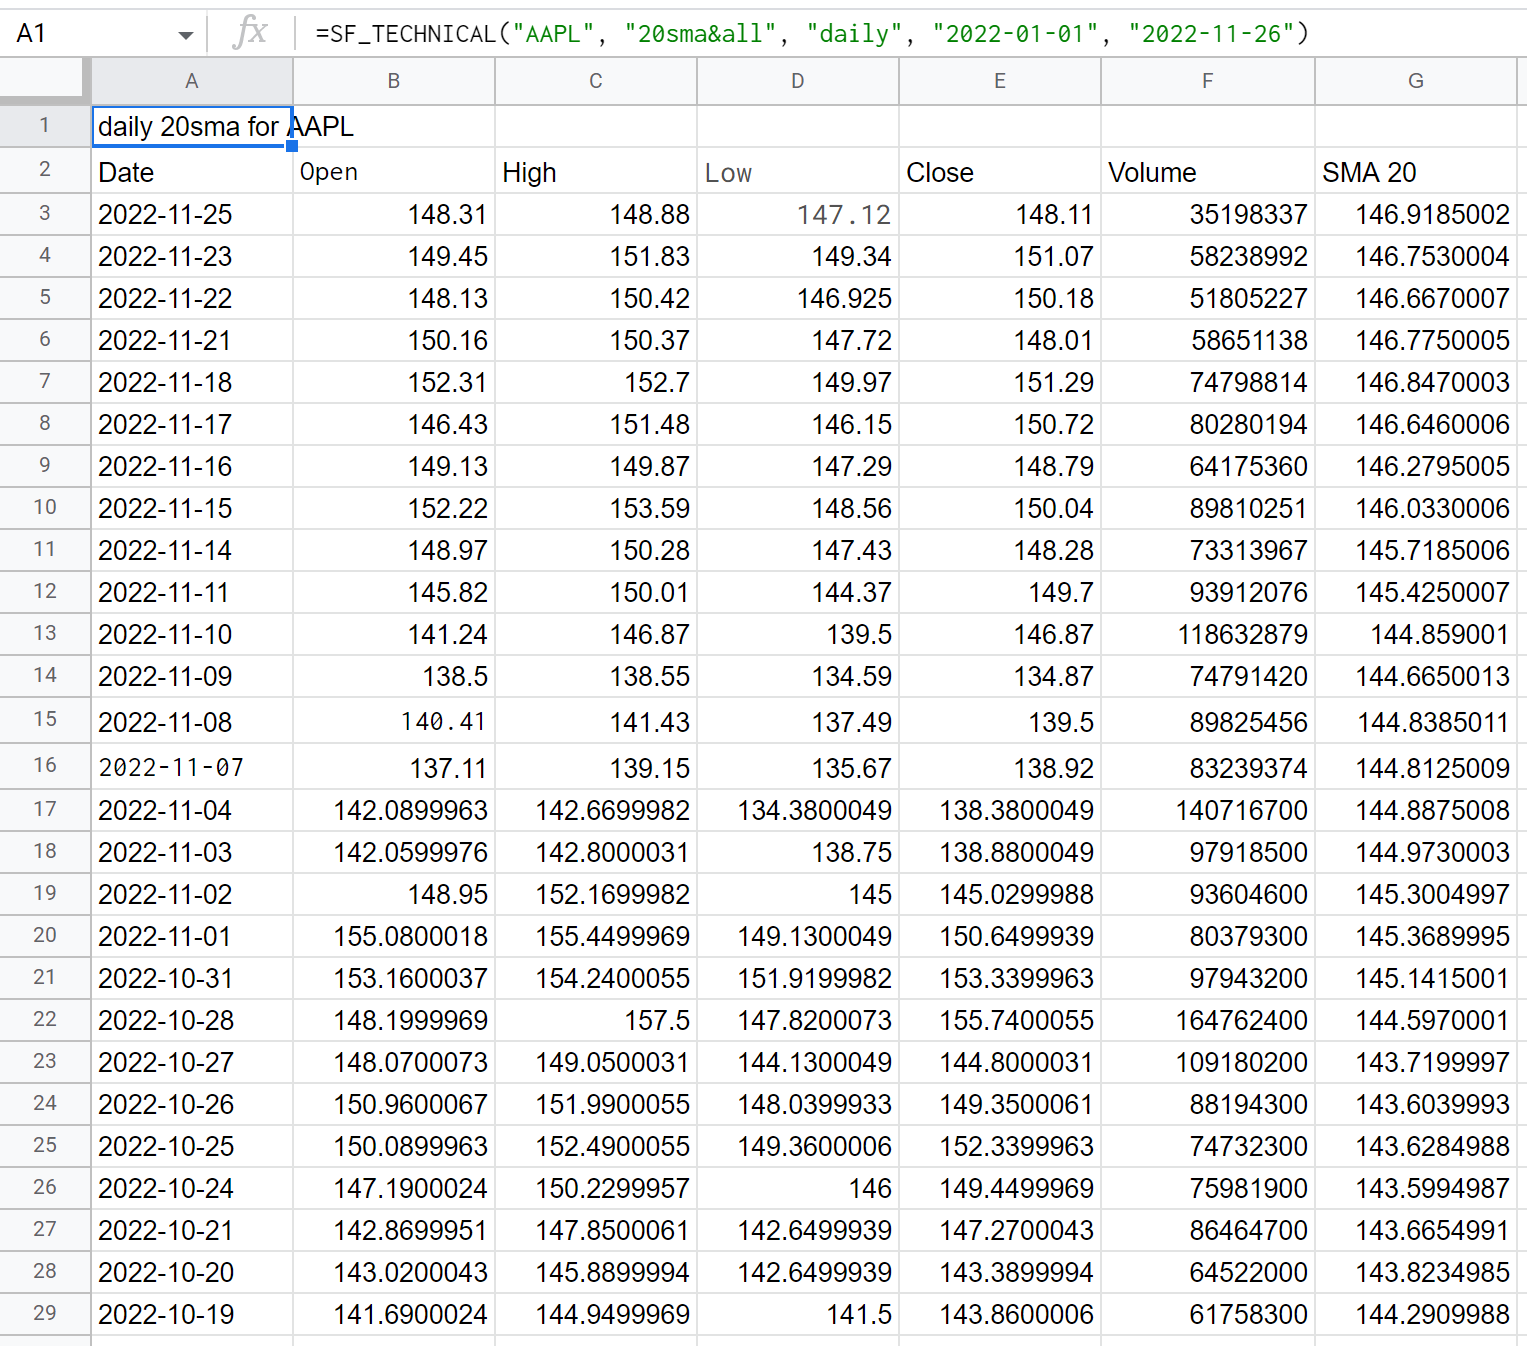
Example 2 - 100 day EMA with only date and close
=SF_TECHNICAL("AAPL", "100ema&date&close", "daily", "2022-01-01", "2022-11-26")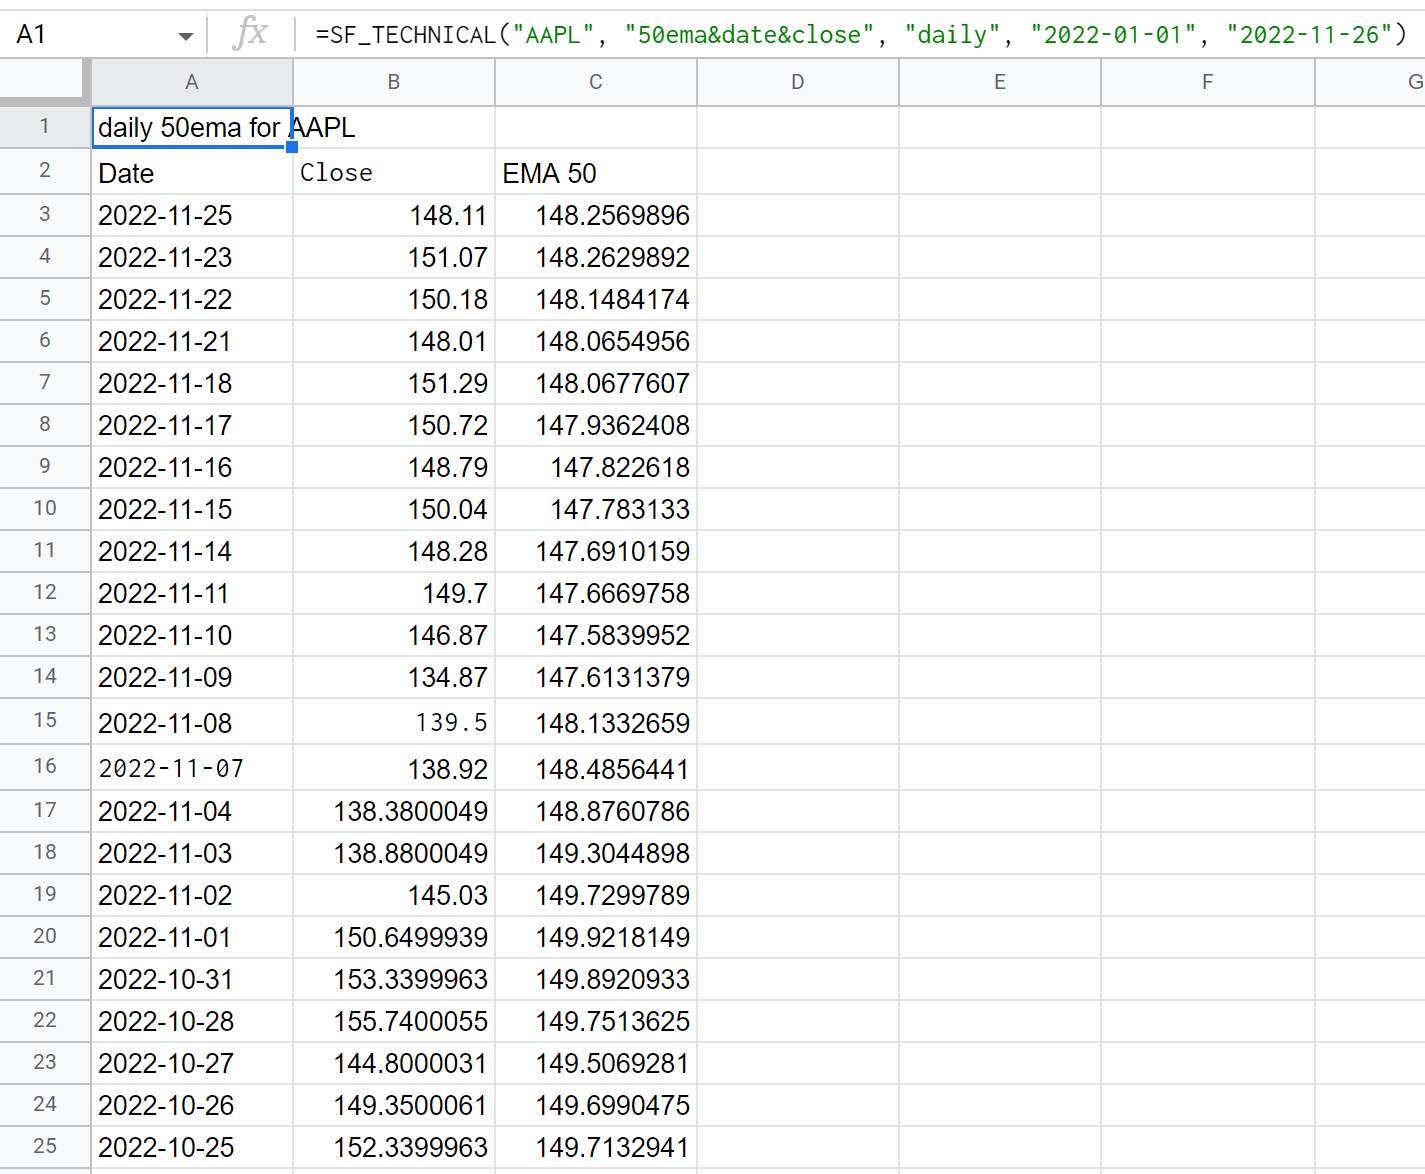
Example 3 - 10 minute intra-day Williams %R with all parameters
=SF_TECHNICAL("AAPL", "10williams&all", "1min", "2022-01-01", "2022-11-26")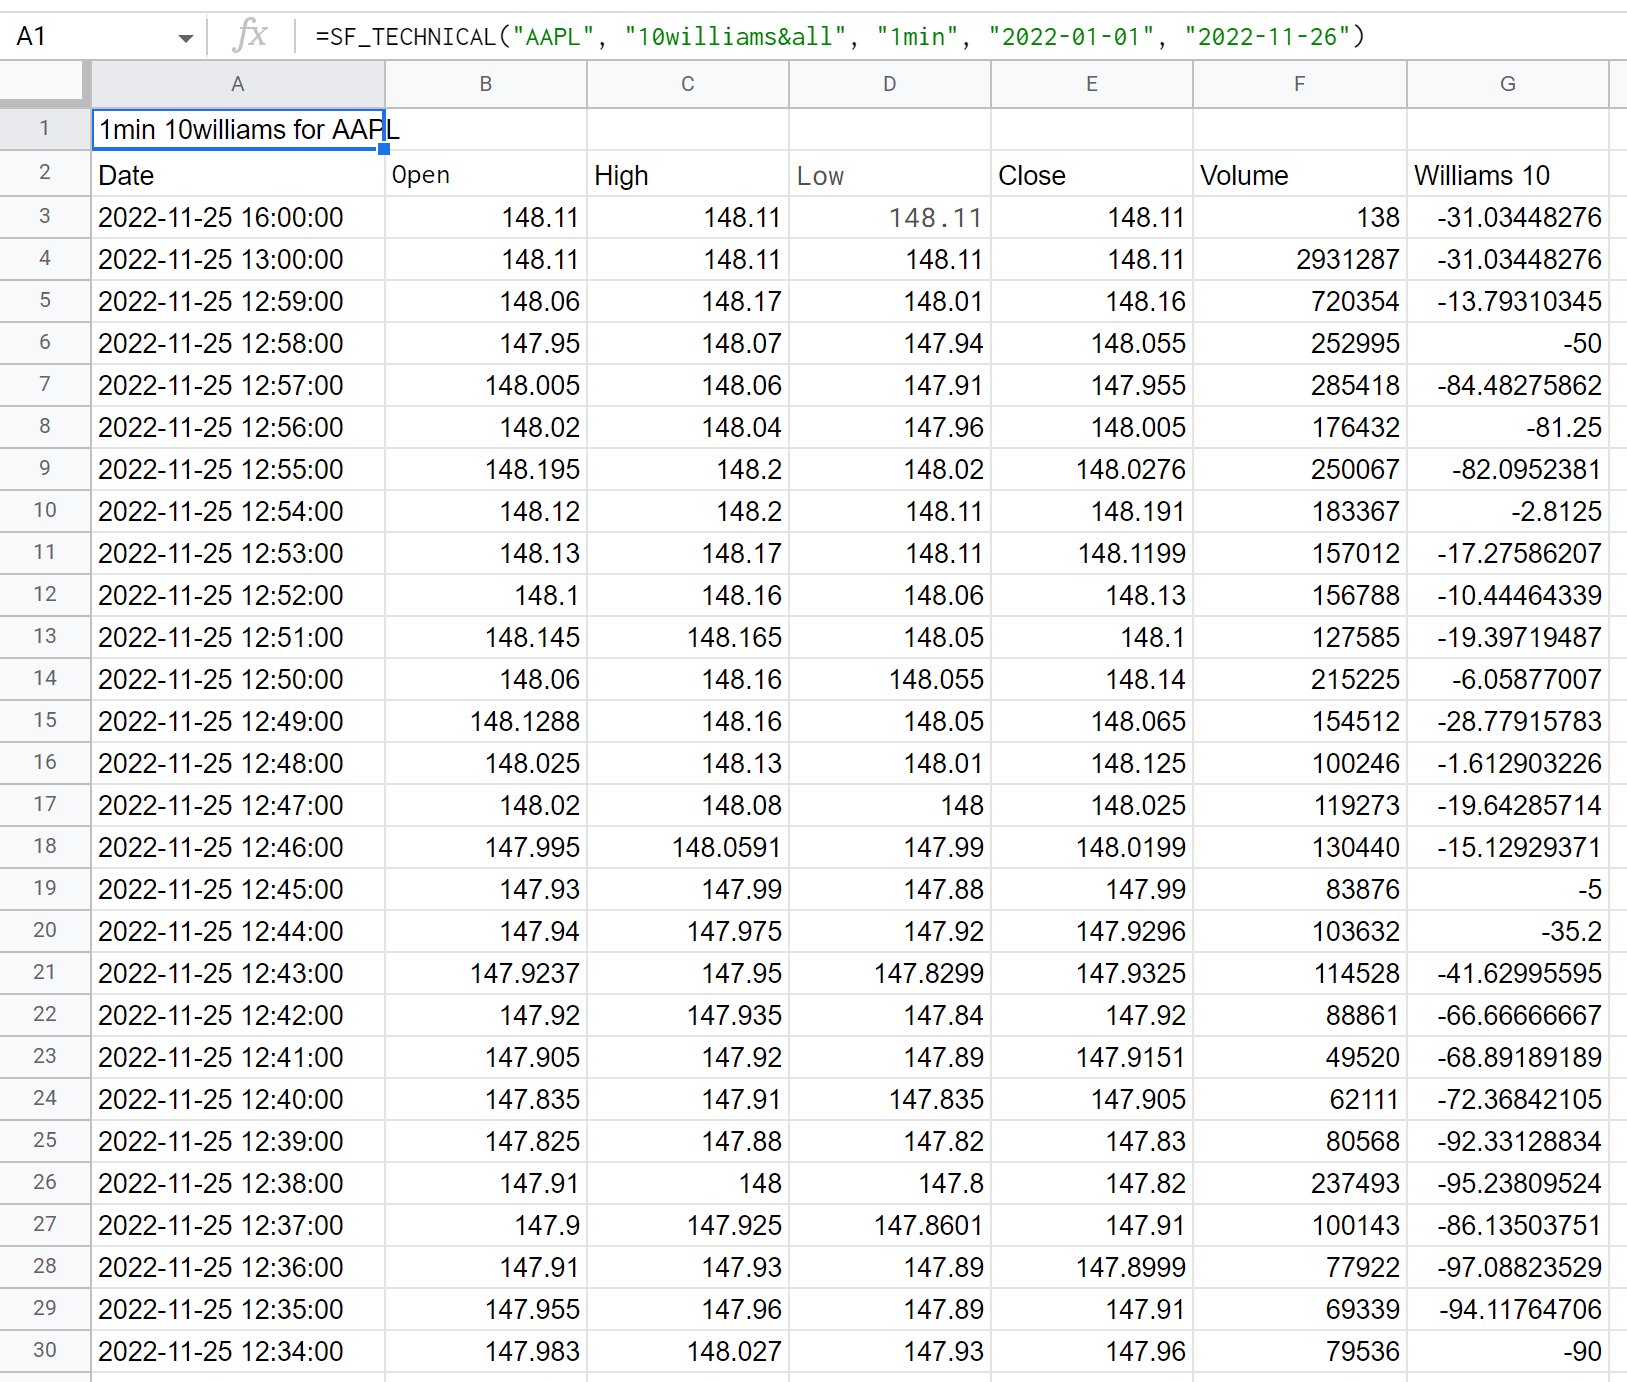
Example 4 - 4 hour intra-day TEMA with date and close, no headers
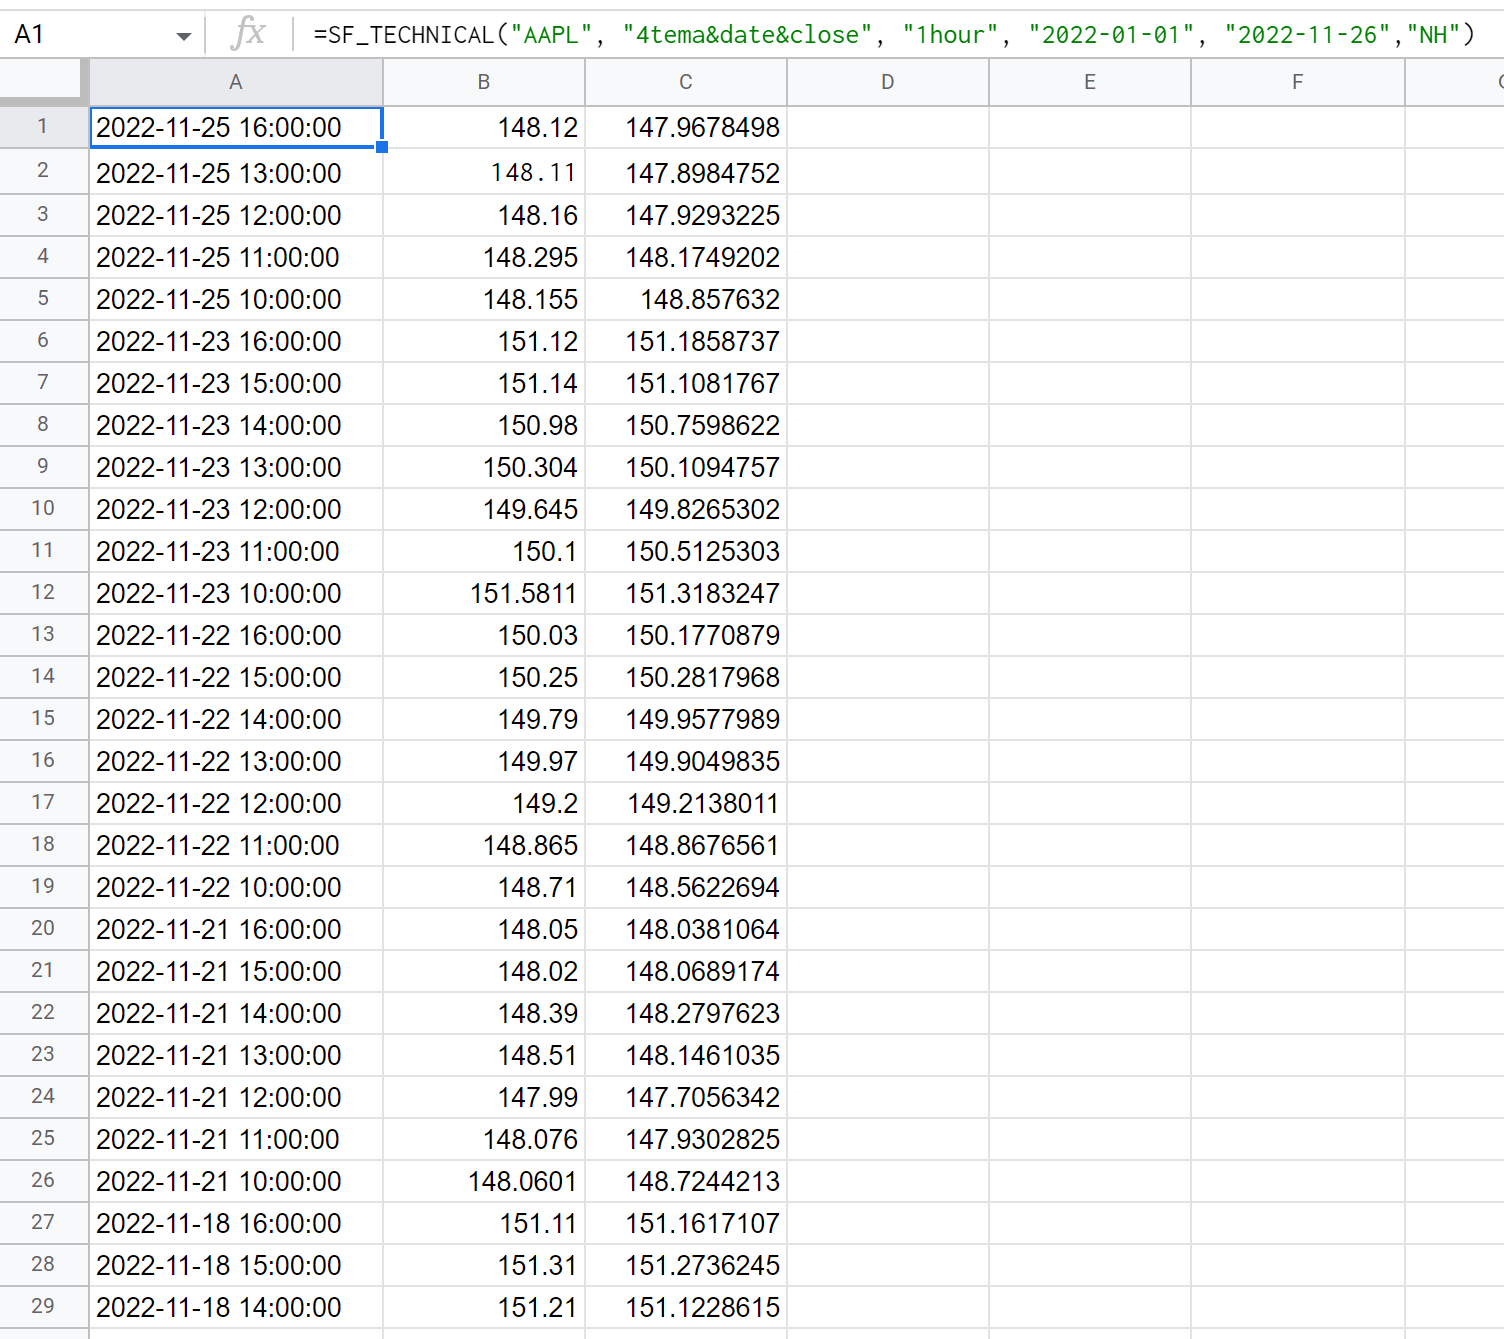
=SF_TECHNICAL("AAPL", "4tema&date&close", "1hour", "2022-01-01", "2022-11-26", "NH")