Sector PE
The sectorPE data type returns the average sector price-to-earnings ratio (PE) for the global exchange market on the date specified.
=SF(exchange, "sectorPE", sectors, date, options)exchangeis the symbol of the exchange (e.g.,"NSE"or"NASDAQ"). You can check our Available Markets to find the correct symbol.sectorsselects what sectors to display. Leave blank or use"all"to display all sectors. Chain together sectors with the&symbol to display more than one (e.g."Technology&Healthcare&Basic Materials"). Note, sector names are case-sensitive and some include spaces.dateis the date for which you want to retrieve the data. The date should either be a date formatted Google Sheets object or a text string in the format ofYYYY-MM-DDorDD/MM/YYYY.optionsadjusts the formatting of the output. Set this field to"NH"for no header rows or"-"for reversed order. You can combine options with the&operator like so"NH&-".
Tip: Use the Function Generator to easily create this function and select the correct sectors.
The sectorPE sectors options are:
All (
"all")Basic Materials (
"Basic Materials")Communication Services (
"Communication Services")Consumer Cyclical (
"Consumer Cyclical")Consumer Defensive (
"Consumer Defensive")Energy (
"Energy")Financial Services (
"Financial Services")Healthcare (
"Healthcare")Industrials (
"Industrials")Real Estate (
"Real Estate")Technology (
"Technology")Utilities (
"Utilities")
Examples
Example 1 - Display all sectors, most recent date
=SF("NASDAQ", "sectorPE")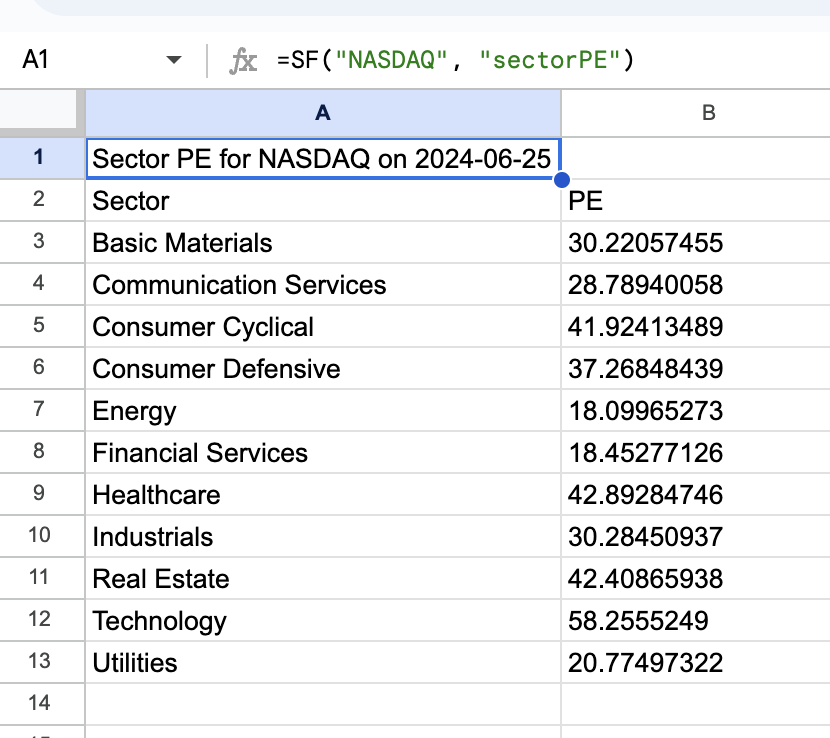
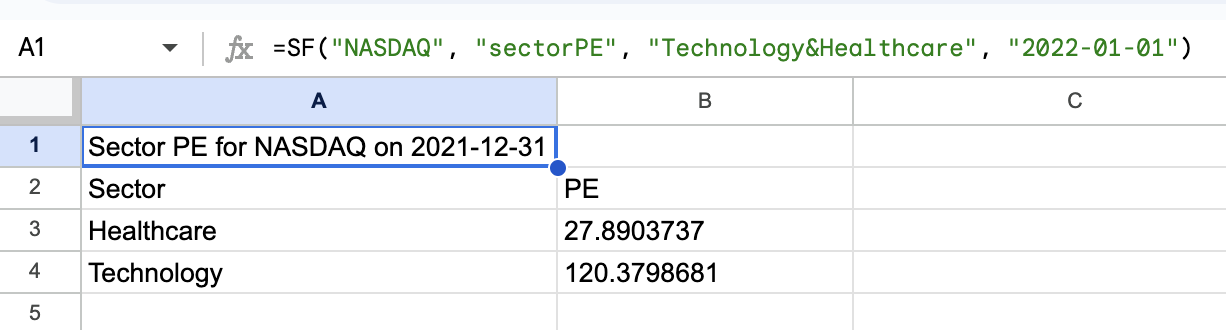
Example 2 - Display several selected sectors, specific date
=SF("NASDAQ", "sectorPE", "Technology&Healthcare", "2022-01-01")