US Treasury Rates
You can generate historical US Treasury rates for 40+ years using the SF_CALENDAR() function with the type parameter set to "treasury".
=SF_CALENDAR("", "treasury", startDate, endDate, metric, header)startDateis the start date for US Treasury rates calendar, written in iso format YYY-MM-DD, e.g."2000-04-03". The maximum range betweenstartDateandendDatefor one function call is 90 days. If the range is larger than this it will be truncated to 90 days.endDateis the end date for the US Treasury rates, written in iso format YYY-MM-DD, e.g."2019-12-24"metricselects what metrics to display. Leave blank or use"all"to display all metrics. Chain together metrics with&symbol to display more than one (e.g."date&month1&month6").optionsadjusts the formatting of the output."-"reverses the default output order and"NH"removes the header on the output. These can be combined like so"-&NH".
Important: Ensure you include the empty first argument "" in the SF_CALENDAR() function when generating US Treasury rates.
The treasury metric options are:
Date (
"date")1 Month (
"month1")2 Month (
"month2")3 Month (
"month3")6 Month (
"month6")1 Year (
"year1")2 Year (
"year2")3 Year (
"year3")5 Year (
"year5")7 Year (
"year7")10 Year (
"year10")20 Year (
"year20")30 Year (
"year30")
Examples
Example 1 - All metrics, last 90 days
=SF_CALENDAR("", "treasury", today()-90, today(), "all", "")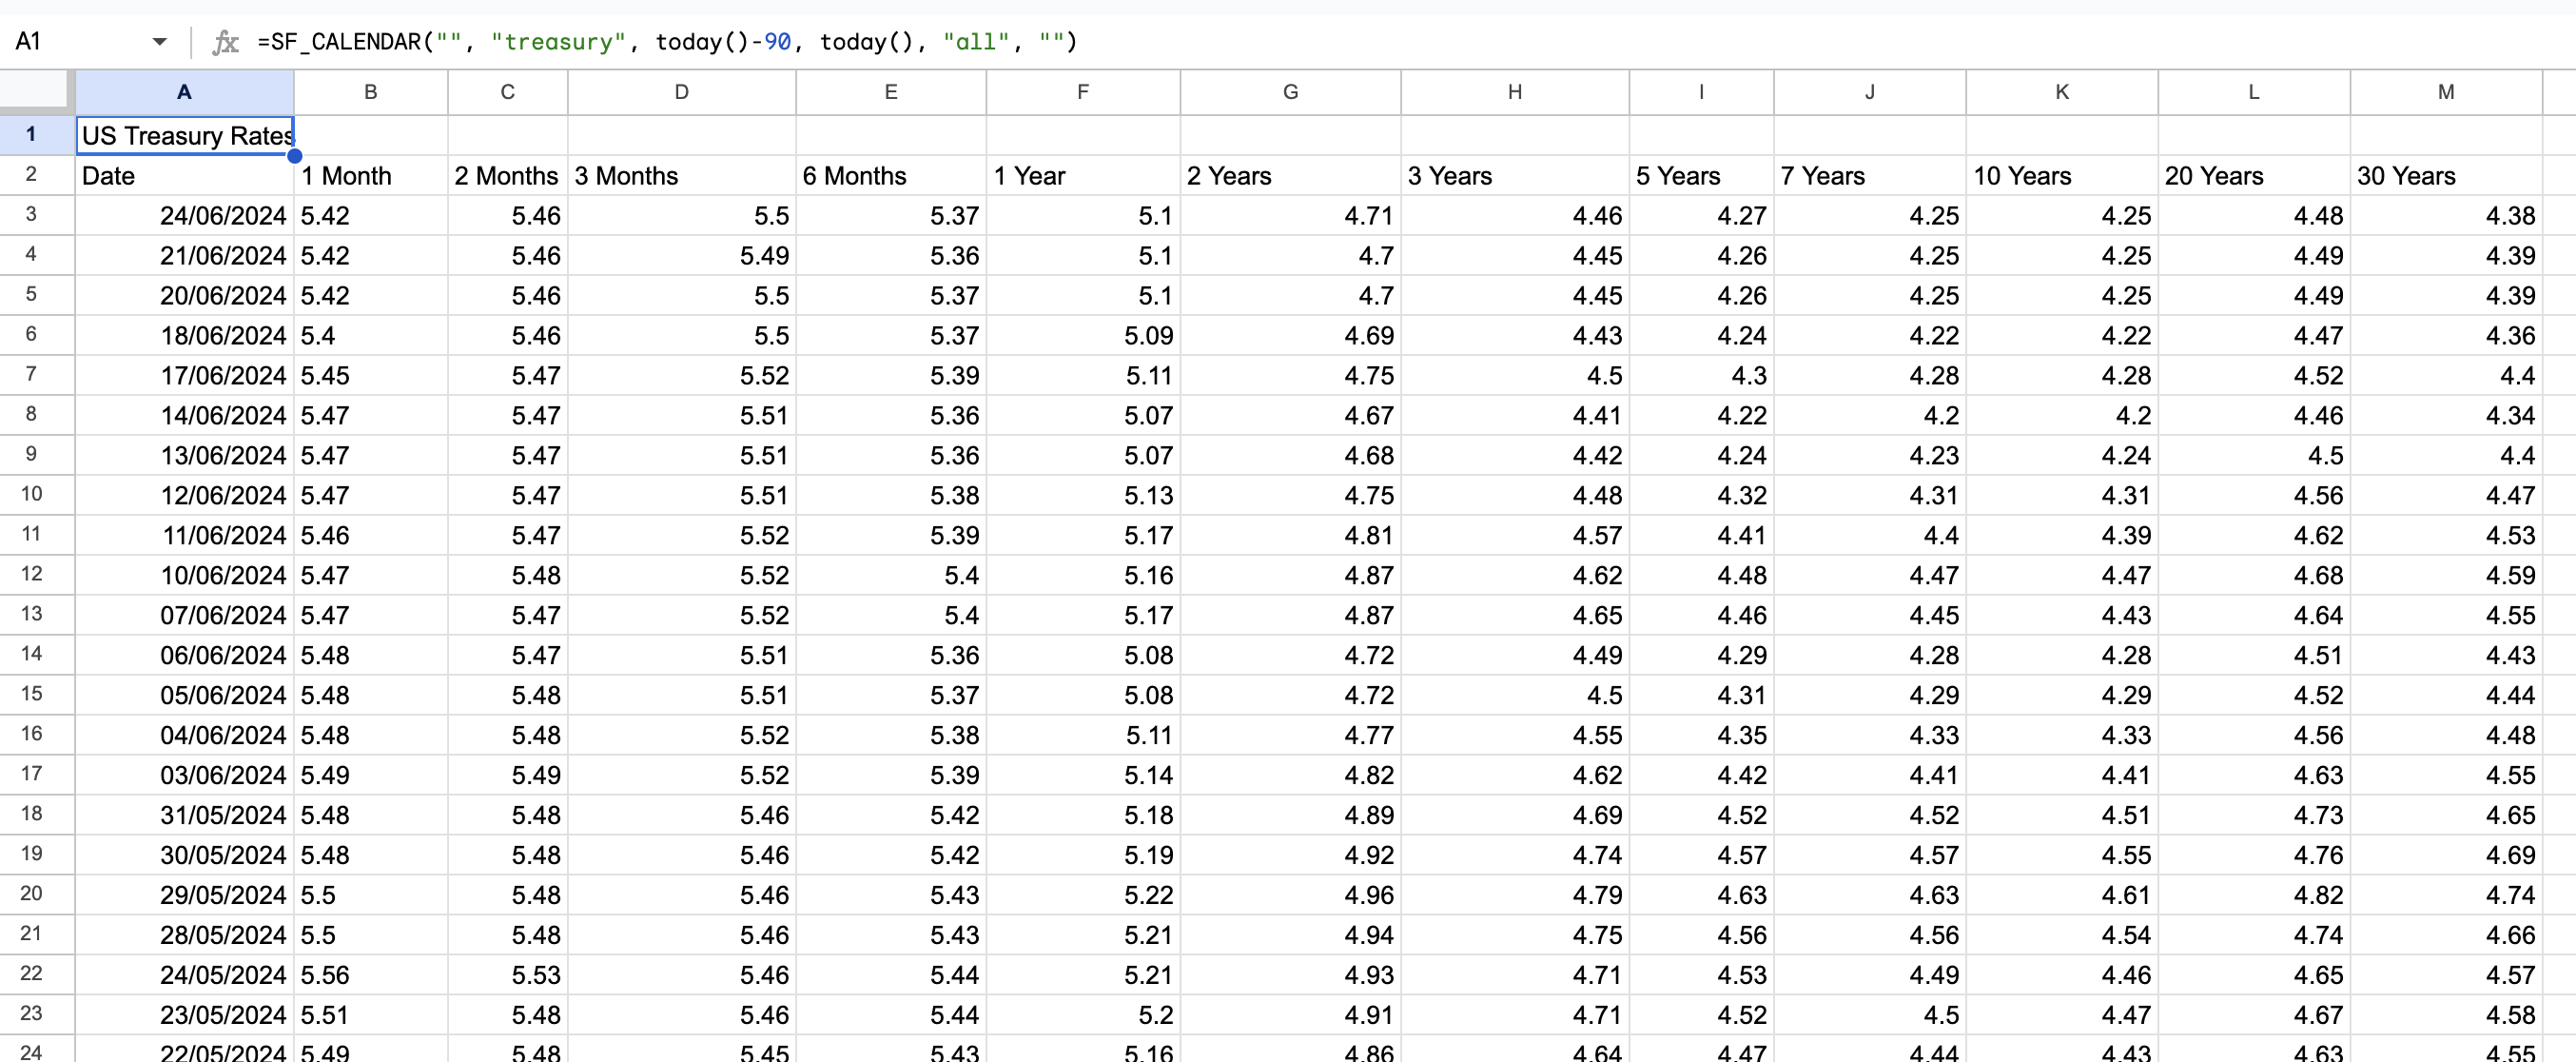
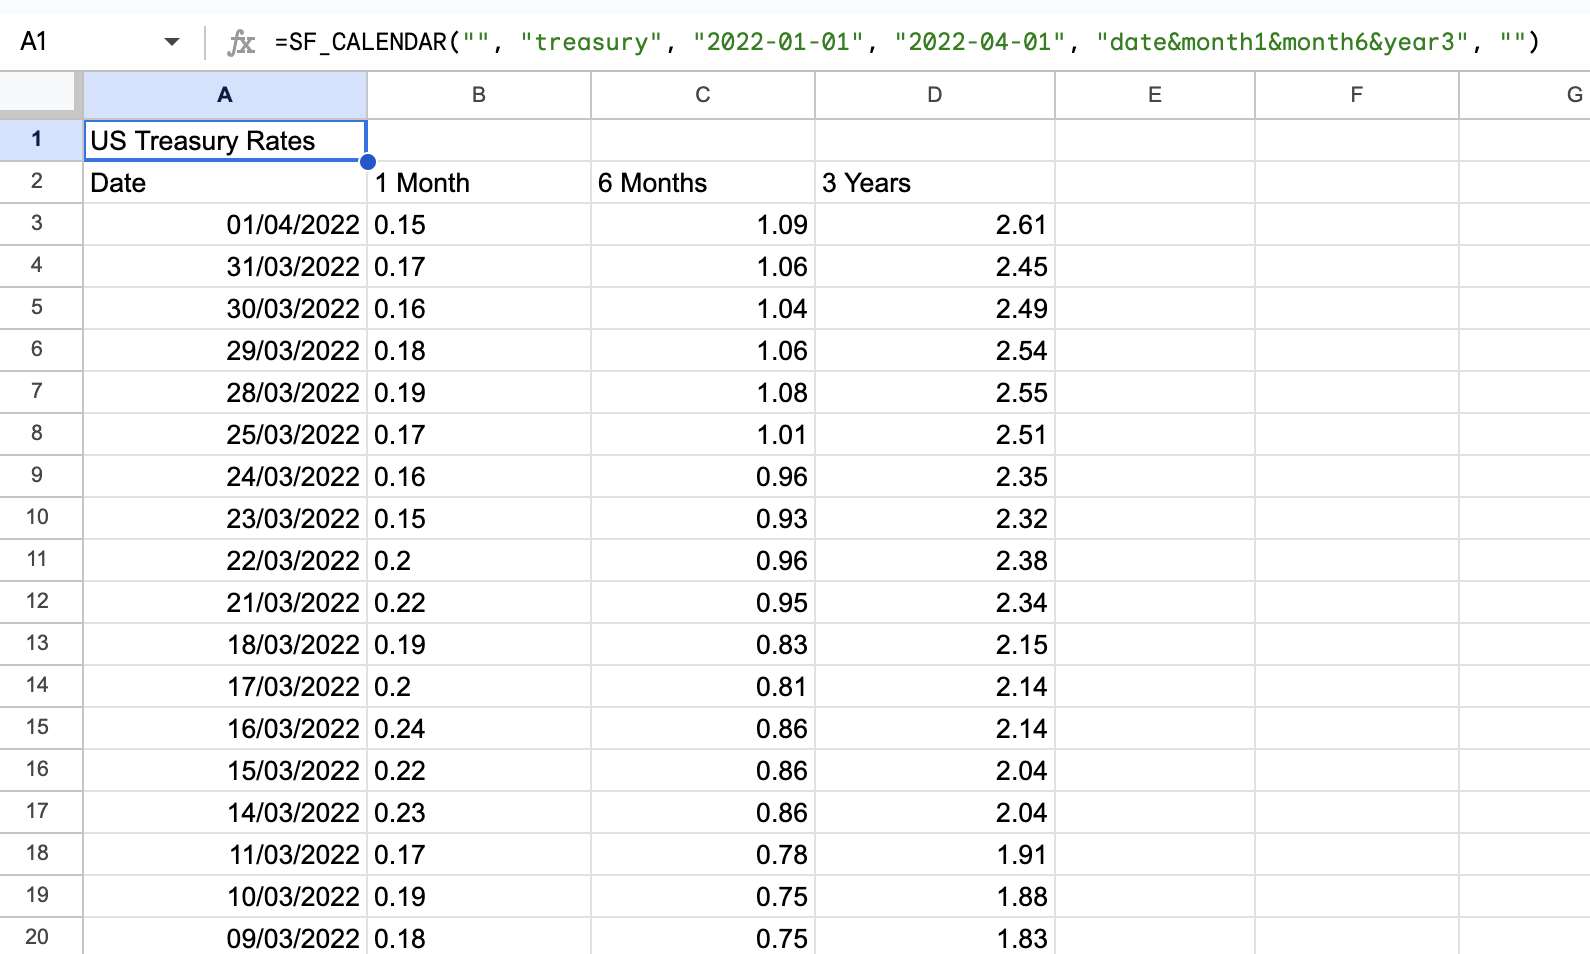
Example 2 - Several metrics, specific dates
=SF_CALENDAR("", "treasury", "2022-01-01", "2022-04-01", "date&month1&month6", "")