By Geography
🇺🇸 Important: Revenue segmentation data is only available for US markets
The revSegGeo data type returns revenue segmentation data by geographical region for a stock. This allows investors to analyze how a company's revenue is distributed across different regions. The data is sourced from SEC filings and reflects company-reported segmentations.
=SF(symbol, type, metrics, year, options)symbolis the ticker symbol of the financial asset (e.g.,"AAPL"). You can use our Symbol Search to find the correct ticker symbol.typedetermines which quarterly or annual revenue segmentation data to display. Options include:Annual Revenue Segmentation (
"revSegGeo")Quarterly Revenue Segmentation for all Quarters (
"revSegGeoQ")Quarterly Revenue Segmentation for Quarter X (
"revSegGeoQX") whereXcan be1,2,3or4
metricsselects what metrics/geographical segements to display (see options below), display all metrics by leaving blank or using"all". Note that each company will have different metrics based on their revenue segmentation. Chain together as many metrics as you'd like using&, e.g. for AAPL,"period&date&Americas&Japan".yearis the year or range of years for which you want to retrieve the data. You can enter a single year (e.g.,2020) or a range of years (e.g.,2019-2021).optionsadjusts the formatting of the output. There are currently four (4) available options. (1)"NH"for no header rows, (2)"NLI"for no line item labels, (3)"-"to reverse the year ordering and (4)"calYear"which adjusts the search to calendar years instead of fiscal years. These options can be chained together with the&operator, for example"NH&NLI&-".
The revenue segmentation by geographical metric options are:
Period (
"period")Date (
"date")Fiscal Year (
"fiscalYear")Geographical-specific segments (varies by company)
Note: The specific geographical segments vary by company. For example, Apple (AAPL) reports revenue under segments such as:
Americas Segment
Europe Segment
Greater China Segment
Japan Segment
Rest of Asia Pacific Segment
Examples
Example 1 - Display the most recent year of revenue segmentation data
=SF("AAPL", "revSegGeo")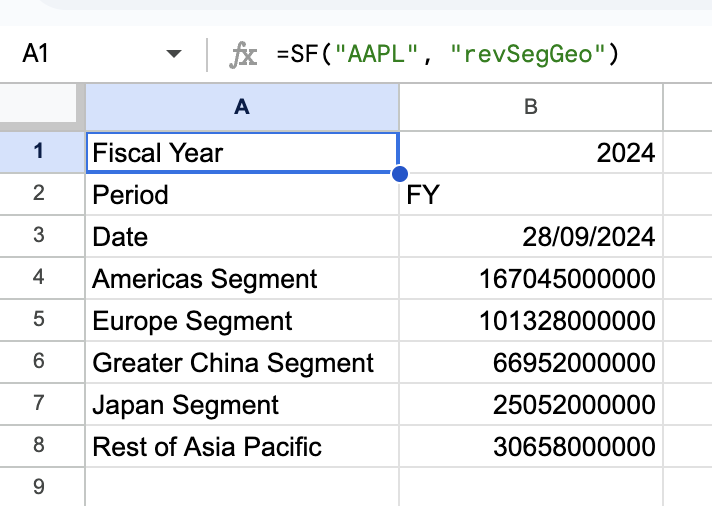
Example 2 - Display revenue segmentation for a specific year
=SF("AAPL", "revSegGeo", "all", "2022")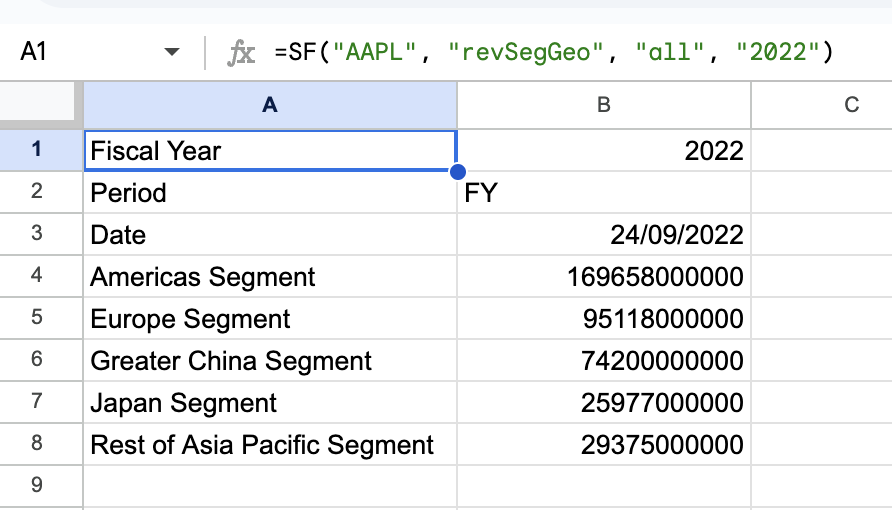
Example 3 - Display several selected metrics for all quarters for a range of years
=SF("AAPL", "revSegGeoQ", "period&date&Americas Segment&Japan Segment", "2023-2024")
Example 4 - Display several selected metrics for a specific quarter of a specific year
=SF("AAPL", "revSegGeoQ1", "period&date&Americas Segment&Japan Segment", "2024")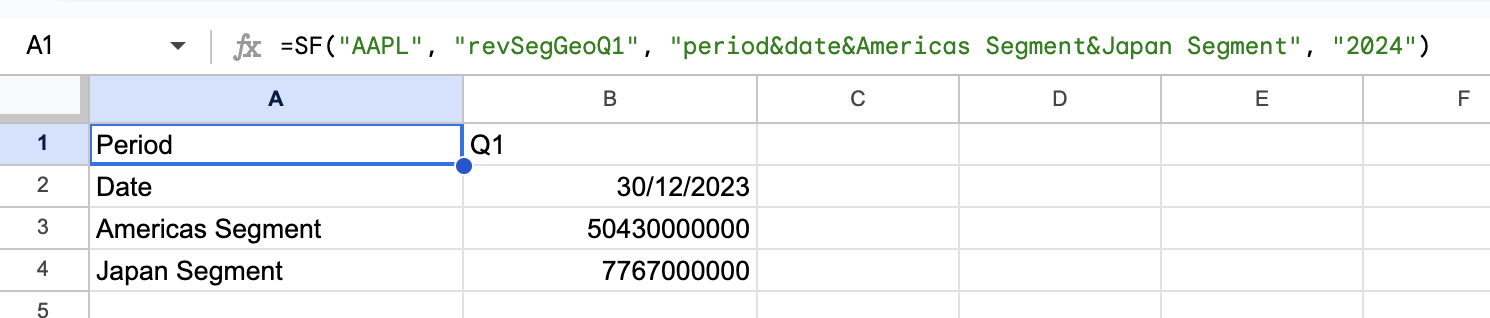
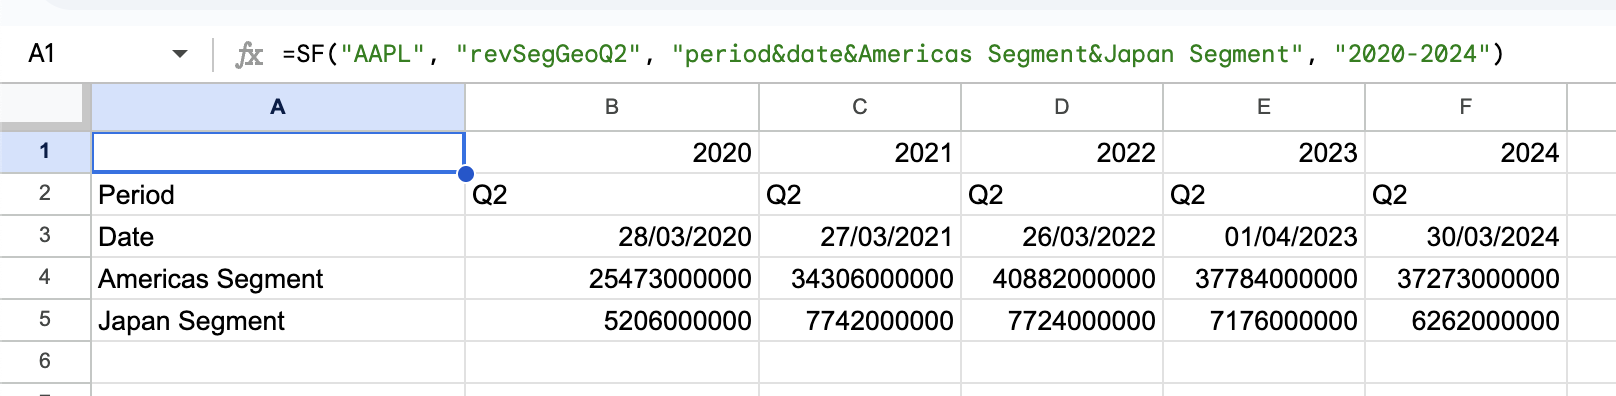
Example 5 - Display several selected metrics for a specific quarter for a range of years
=SF("AAPL", "revSegGeoQ2", "period&date&Americas Segment&Japan Segment", "2020-2024")