Company Growth
The growth function delivers percentage growth metrics for an asset from a specified year or quarter. This includes, for example, the percentage growth of company financials such as net income and gross profit, or the growth of important per share statistics such as EPS. The growth function also includes multi-year growth metrics such as 3, 5 and 10 year revenue per share growth. In this case, the figure is calculated as the absolute percentage change of that metric over the period, e.g., 3 year revenue per share growth in 2022 is the percentage change in revenue per share from 3 years ago (2019) to today. A series of examples are provided below.
=SF(symbol, type, metrics, year(s), options)symbolis the ticker symbol of the financial asset (e.g.,"AAPL"). You can use our Symbol Search to find the correct ticker symbol.typeis where you specify which type of growth data you are after, leave it as just"growth"for annual growth data, or append the specific quarter for quarterly growth data. For example, enter"growthQ1"for Q1 growth data, or"growthQ2"for Q2 growth data.metricsis the growth metric(s) you are after, for example"revenueGrowth"or"revenueGrowth&ebitgrowth÷ndsperShareGrowth". You can leave this blank or set it to"all"to output ALL available growth metrics. You can also chain together multiple metrics using the&operator, for example"ebitgrowth÷ndsperShareGrowth". See the full list of over 30 available growth metrics below.yearis the year for the growth data, e.g.,"2020". This can also be set to a range of years, e.g."2010-2020"to return multiple years of growth data, both quarterly and annual, in one call.optionsadjusts the formatting of the output. There are currently four (5) available options. (1)"NH"for no header rows, (2)"NLI"for no line item labels, (3)"-"to reverse the year ordering, (4)"calYear"which adjusts the search to calendar years instead of fiscal years and (5)"pad"which adds padding of empty columns to the output for missing years or quarters. These options can be chained together with the&operator, for example"NH&NLI&-".
Tips:
You can enter a range of years for both annual and quarterly growth data, e.g.,
"2015-2021"and get multiple years output side-by-side.Use the options parameter to reverse the year ordering, remove the header and/or line item labels.
If you input a range of years and don't specify the quarter number, e.g.
=SF("AAPL", "growthQ", "all", "2010-2020")you will be returned all quarters for each year in the range.If you do not provide the
yearparameter this function will default to the most recently reported annual or quarterly growth data.Data is outputed in raw/decimal format, therefore 0.106 = 10.6%.
The growth data type has the following metrics to select from:
All (
"all")Revenue Growth (
"revenueGrowth")Gross Profit Growth (
"grossProfitGrowth")EBIT Growth (
"ebitgrowth")Operating Income Growth (
"operatingIncomeGrowth")Net Income Growth (
"netIncomeGrowth")EPS Growth (
"epsgrowth")EPS Diluted Growth (
"epsdilutedGrowth")Weighted Average Shares Growth (
"weightedAverageSharesGrowth")Weighted Average Shares Diluted Growth (
"weightedAverageSharesDilutedGrowth")Dividends per Share Growth (
"dividendsperShareGrowth")Operating Cash Flow Growth (
"operatingCashFlowGrowth")Free Cash Flow Growth (
"freeCashFlowGrowth")10y Revenue Growth Per Share (
"tenYRevenueGrowthPerShare")5y Revenue Growth Per Share (
"fiveYRevenueGrowthPerShare")3y Revenue Growth Per Share (
"threeYRevenueGrowthPerShare")10y Operating CF Growth Per Share (
"tenYOperatingCFGrowthPerShare")5y Operating CF Growth Per Share (
"fiveYOperatingCFGrowthPerShare")3y Operating CF Growth Per Share (
"threeYOperatingCFGrowthPerShare")10y Net Income Growth Per Share (
"tenYNetIncomeGrowthPerShare")5y Net Income Growth Per Share (
"fiveYNetIncomeGrowthPerShare")3y Net Income Growth Per Share (
"threeYNetIncomeGrowthPerShare")10y Shareholders Equity Growth Per Share (
"tenYShareholdersEquityGrowthPerShare")5y Shareholders Equity Growth Per Share (
"fiveYShareholdersEquityGrowthPerShare")3y Shareholders Equity Growth Per Share (
"threeYShareholdersEquityGrowthPerShare")10y Dividend per Share Growth Per Share (
"tenYDividendperShareGrowthPerShare")5y Dividend per Share Growth Per Share (
"fiveYDividendperShareGrowthPerShare")3y Dividend per Share Growth Per Share (
"threeYDividendperShareGrowthPerShare")Receivables Growth (
"receivablesGrowth")Inventory Growth (
"inventoryGrowth")Asset Growth (
"assetGrowth")Book Value per Share Growth (
"bookValueperShareGrowth")Debt Growth (
"debtGrowth")R&D Expense Growth (
"rdexpenseGrowth")SG&A Expenses Growth" (
"sgaexpensesGrowth")
Examples
Example 1 - Single metric (EPS Growth)
=SF("AAPL", "growth", "epsgrowth", "2022")

0.08465608466 (8.47%)
Example 2 - Multiple annual metrics (EPS Growth & Revenue Growth)
=SF("AAPL", "growth", "epsgrowth&revenueGrowth", "2022")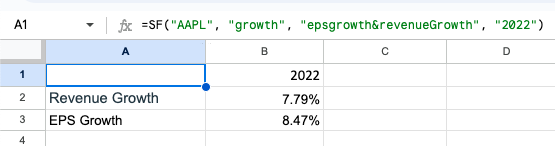
Example 3 - Multiple years and all metrics
=SF("AAPL", "growth", "all", "2012-2022")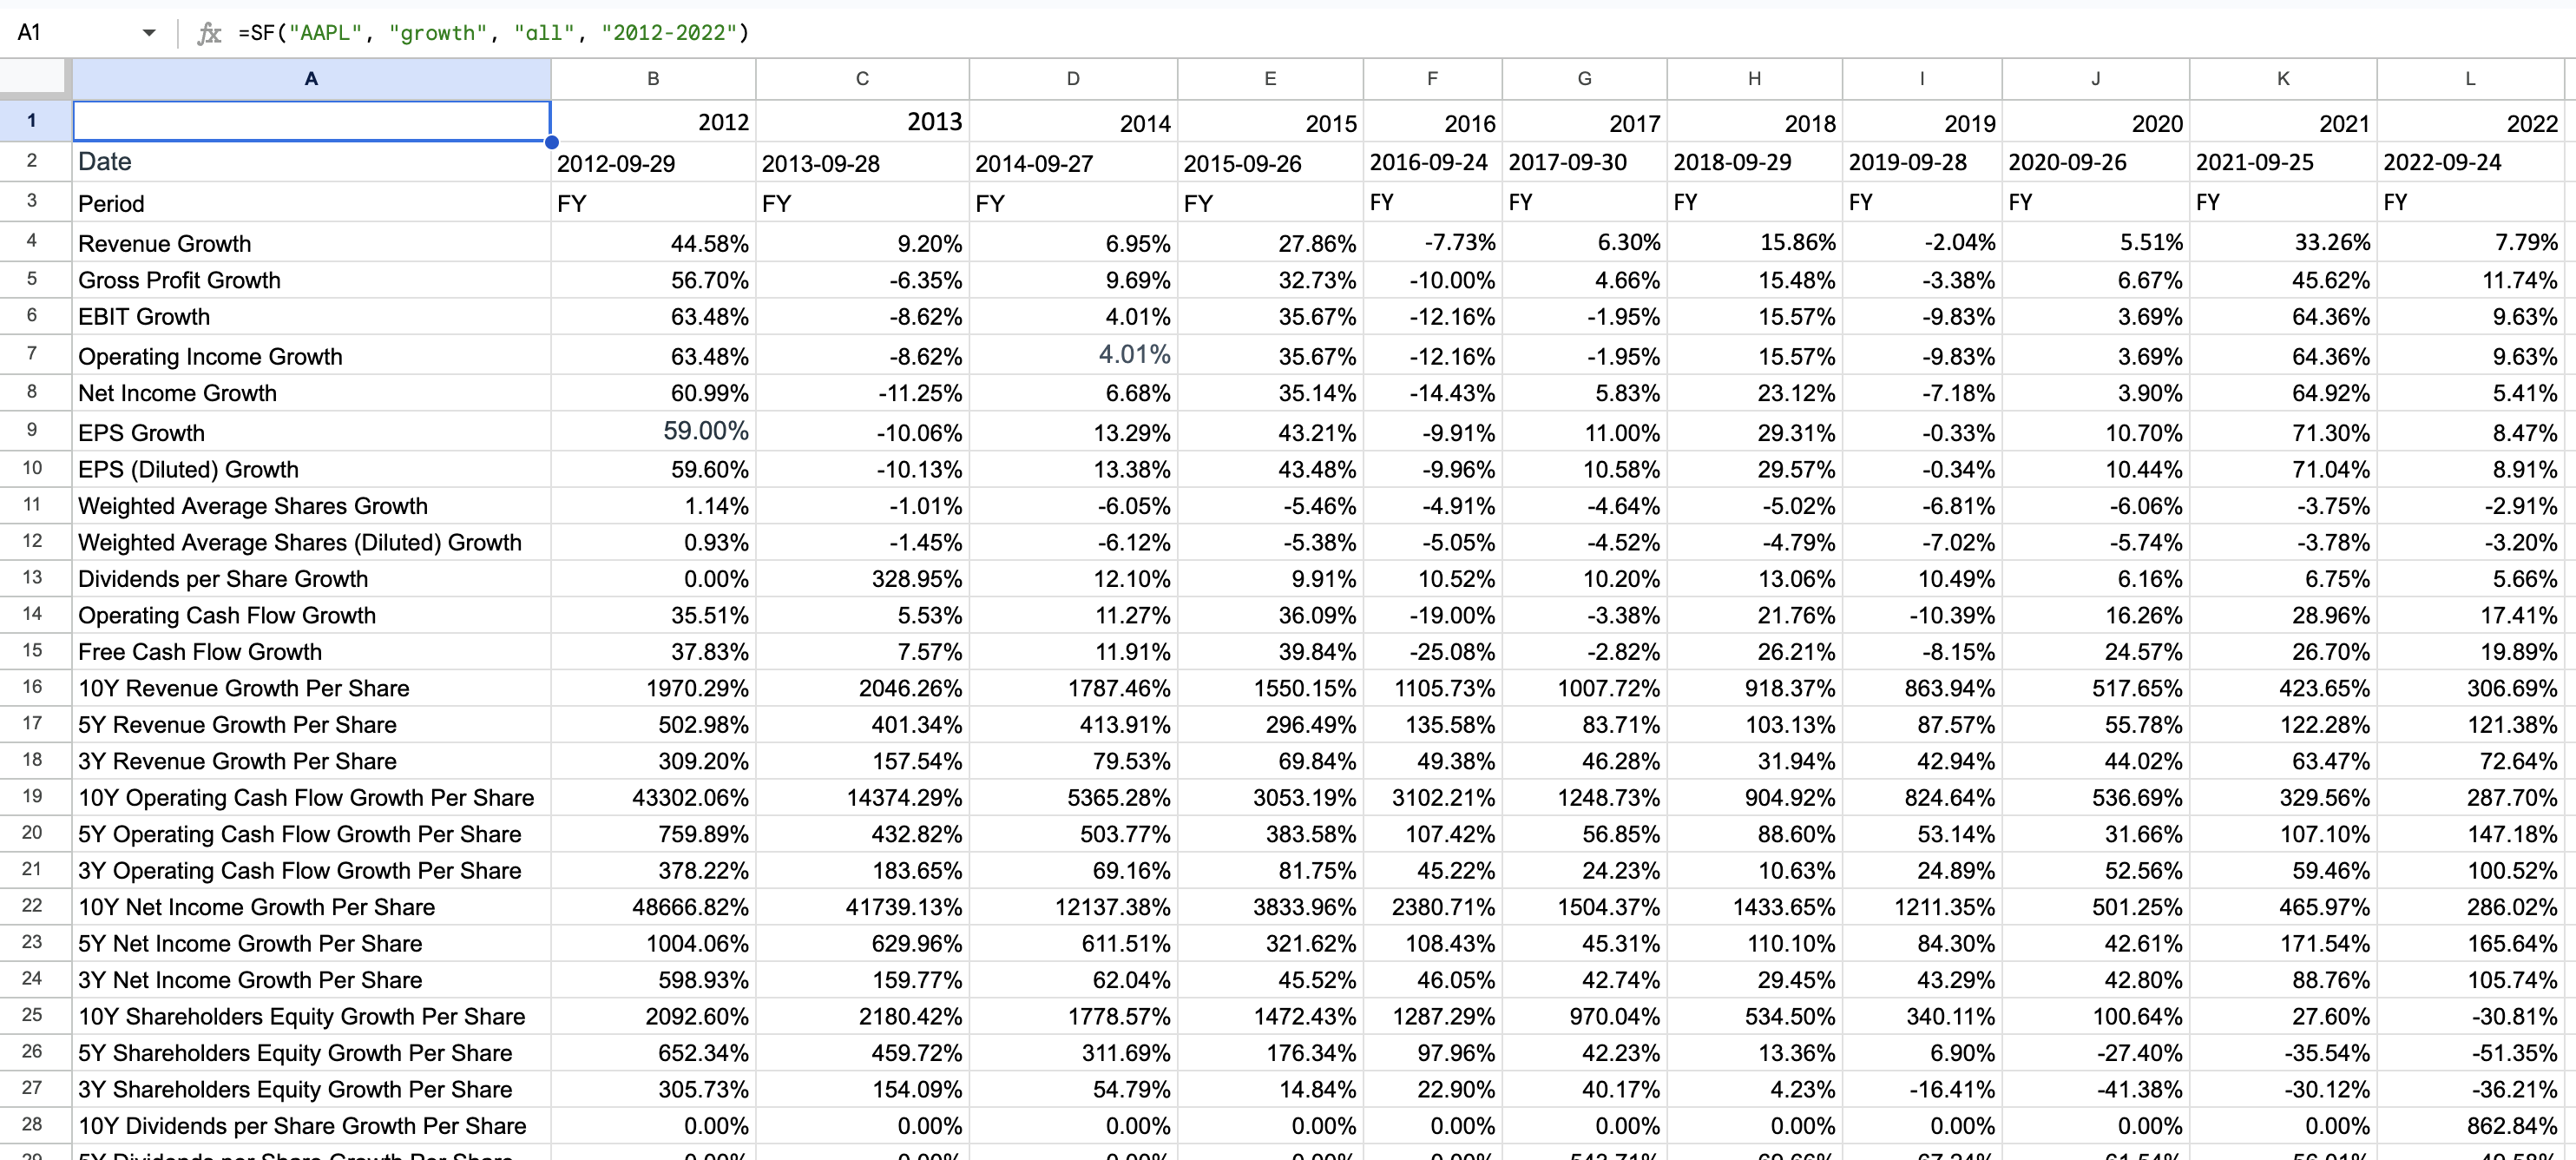
Example 4 - Quarterly growth data for Q4 2022
=SF("AAPL", "growthQ4", "all", "2022")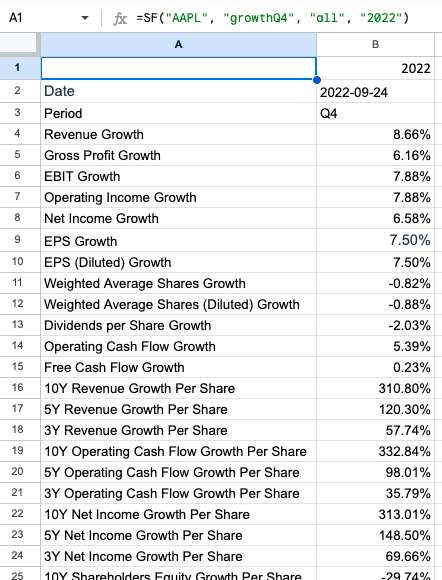
Example 5 - Several growth metrics with no header rows and no line item labels
=SF("AAPL", "growth", "dividendsperShareGrowth&netIncomeGrowth&ebitgrowth", "2022", "NH&NLI")
Example 6 - Multiple years and reversed year ordering
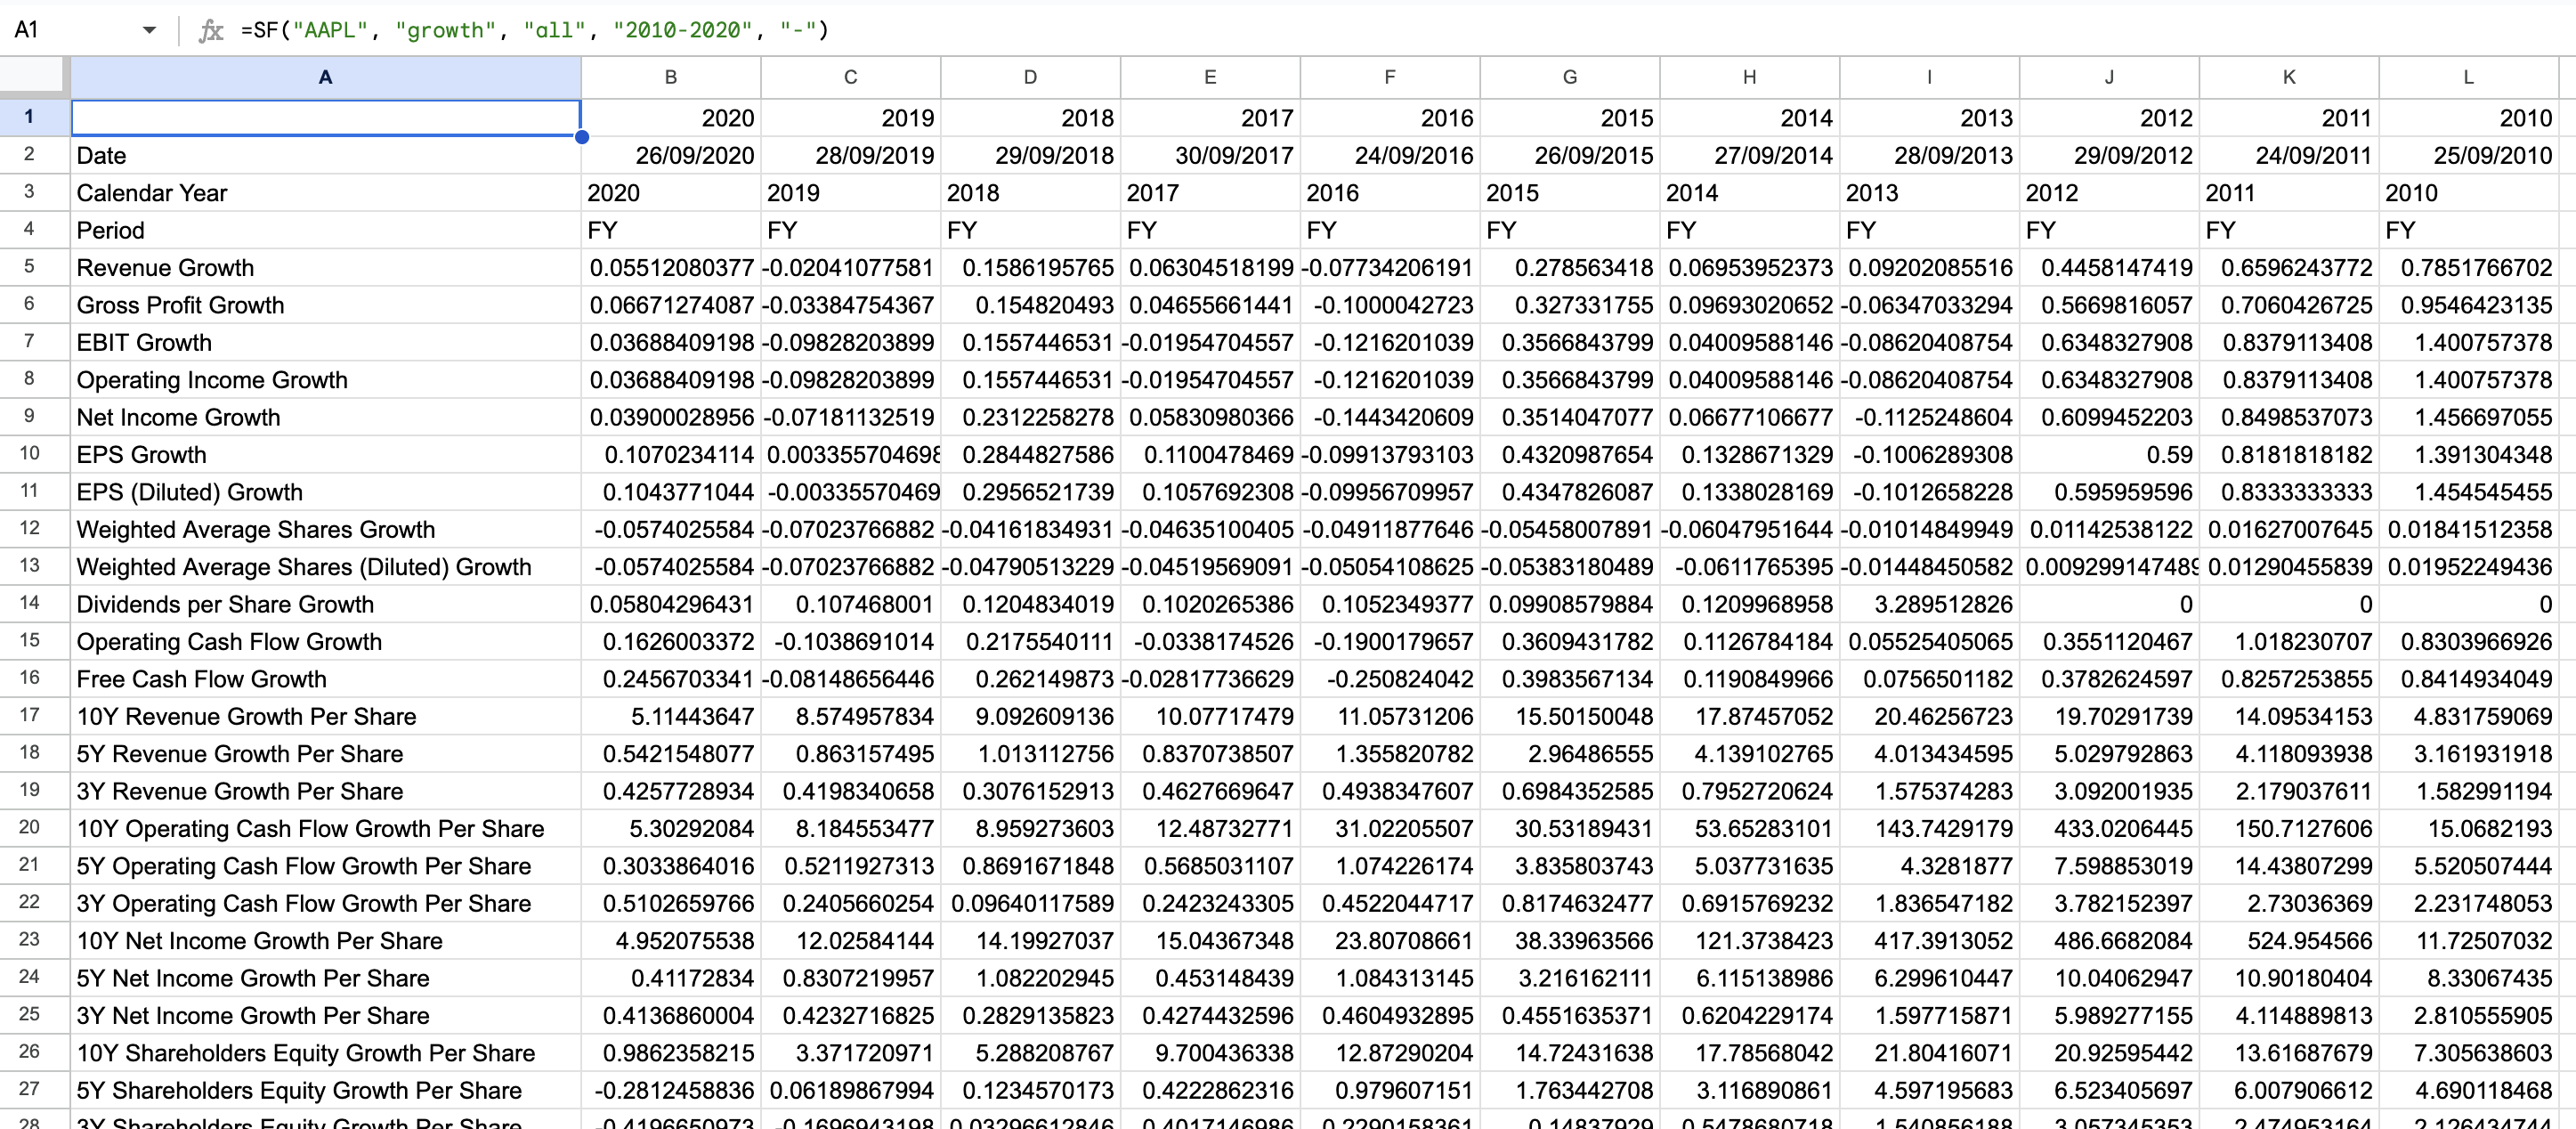
=SF("AAPL", "growth", "all", "2010-2020", "-")