Historical Financials (Deprecated)
Deprecated (November 2025): These statement functions have been deprecated. Whilst we intend to continue supporting them for the foreseeable future we strongly recommend using the new statement functions which provide significantly more data with improved standardisation. See the new documentation under Financial Statements.
Historical financials is a powerful data source that allows you to access over 30 years of annual and quarterly consolidated financial statements. You can generate a specific year/quarter or dump multiple years/quarters of statements. Historical financials are accessed using the same SF() formula.
=SF(symbol, type, metrics, year, options)symbolis the ticker symbol of the financial asset (e.g.,"AAPL"). You can use our Symbol Search to find the correct ticker symbol.typeis the type of historical financial you are after, the options are outlined below in the type parameter.metricsspecify the line items of that financial statement you are after, such as"revenue"for the income statement. You can leave this blank or set it to"all"to output the entire statement, see the "all" option. Available metrics/line items for each statement are outlined in detail below in Income Statement, Balance Sheet and Cash Flow. You chain together as few or as many metrics as you'd like using the&operator, for example,"calendarYear&revenue&netIncome&eps".yearis the year of the financial statement, e.g.,"2020". This parameter can be set to a date when generating a historical TTM report, see Historical TTM Report. This can also be set to a range of years, e.g."2010-2020"to return multiple years of financial statements, both quarterly and annual, in one call, see Multiple Years. Lastly, this can be set to"ttm"(for"historicalFinancialIncome"and"historicalFinancialsCash") to return the TTM statements.optionsadjusts the formatting of the output. There are currently four (4) available options. (1) Set this field to"NH"for no header rows,(2)"NLI"for no line item labels, (3)"-"to reverse the year ordering and (4)"sum"when generating a Historical TTM Report to return the summed TTM value from any date in history. These options can be chained together with the&operator, for example"NH&NLI&-".
Tips:
You can enter a range of years for annual and quarterly reports, e.g.,
"2015-2021"and get multiple years output side-by-side, see the Multiple Years section.Use the options parameter to reverse the year ordering and to remove the header rows and/or line item labels.
If you generate a Historical TTM Report with the option
"sum"you will return the summed TTM value from any date in history.If you do not supply the
"year"parameter the formula will default to the most recently reported figure.
The type parameter
There a 3 historical financials data types for annual reports:
Income Statement (
"historicalFinancialsIncome")Balance Sheet (
"historicalFinancialsBalance")Cashflow Statement (
"historicalFinancialsCash")
There are 4 data types for each quarterly report:
Income Statement Quarter X (
"historicalFinancialsIncomeQX") whereXcan be1,2,3or4Balance Sheet Quarter X (
"historicalFinancialsBalanceQX") whereXcan be1,2,3or4Cashflow Statement Quarter X (
"historicalFinancialsCashQX") whereXcan be1,2,3or4
For multi-year statement dumps (e.g. "2010-2020") you can select from any of the above type parameters or you can use "historicalFinancialsCashQ" to display all quarters, rather than just a specific quarter, i.e. only Q1.
Lastly you can select a historical TTM report by appending TTM to the end of the one of the annual types, for example "historicalFinancialsIncomeTTM".
Quick examples
Example 1 - Annual report, full report
=SF("AAPL", "historicalFinancialsIncome", "all", "2019")

[multi-dimensional array]
Example 2 - Annual report, single line item
=SF("AAPL", "historicalFinancialsIncome", "revenue", "2019")

260174000000
Example 3 - Quarterly (Q1) report, single line item
=SF("AAPL", "historicalFinancialsIncomeQ1", "revenue", "2019")

91819000000
Example 4 - Trailing Twelve Months (TTM), single line item
You can access the most current TTM data for each line item of the income statement by replacing the year parameter with "ttm" like so:
=SF("AAPL", "historicalFinancialsIncome", "revenue", "ttm")

378323000000
Example 5 - Trailing Twelve Months (TTM), full report
Using "ttm" works the same as any yearly statement, for example you could call a TTM version of the entire income statement like so:
=SF("AAPL", "historicalFinancialsIncome", "all", "ttm")

[multi-dimensional array]
IMPORTANT:
Only available for the Income Statement and Cash Flow Statement.
Example 5 - Multiple years statement dump
You can access 30+ years of financial statements side-by-side with one function like so:
=SF("AAPL", "historicalFinancialsIncome", "all", "2010-2020")

[multi-dimensional array]
The same applies for quarterly statements:
=SF("AAPL", "historicalFinancialsIncomeQ", "all", "2010-2020")

[multi-dimensional array]
Or for a specific quarter compared year-on-year:
=SF("AAPL", "historicalFinancialsIncomeQ1", "all", "2010-2020")

[multi-dimensional array]
Example 7 - Historical TTM report
You can generate a historical TTM report from any specified date historically with the following:
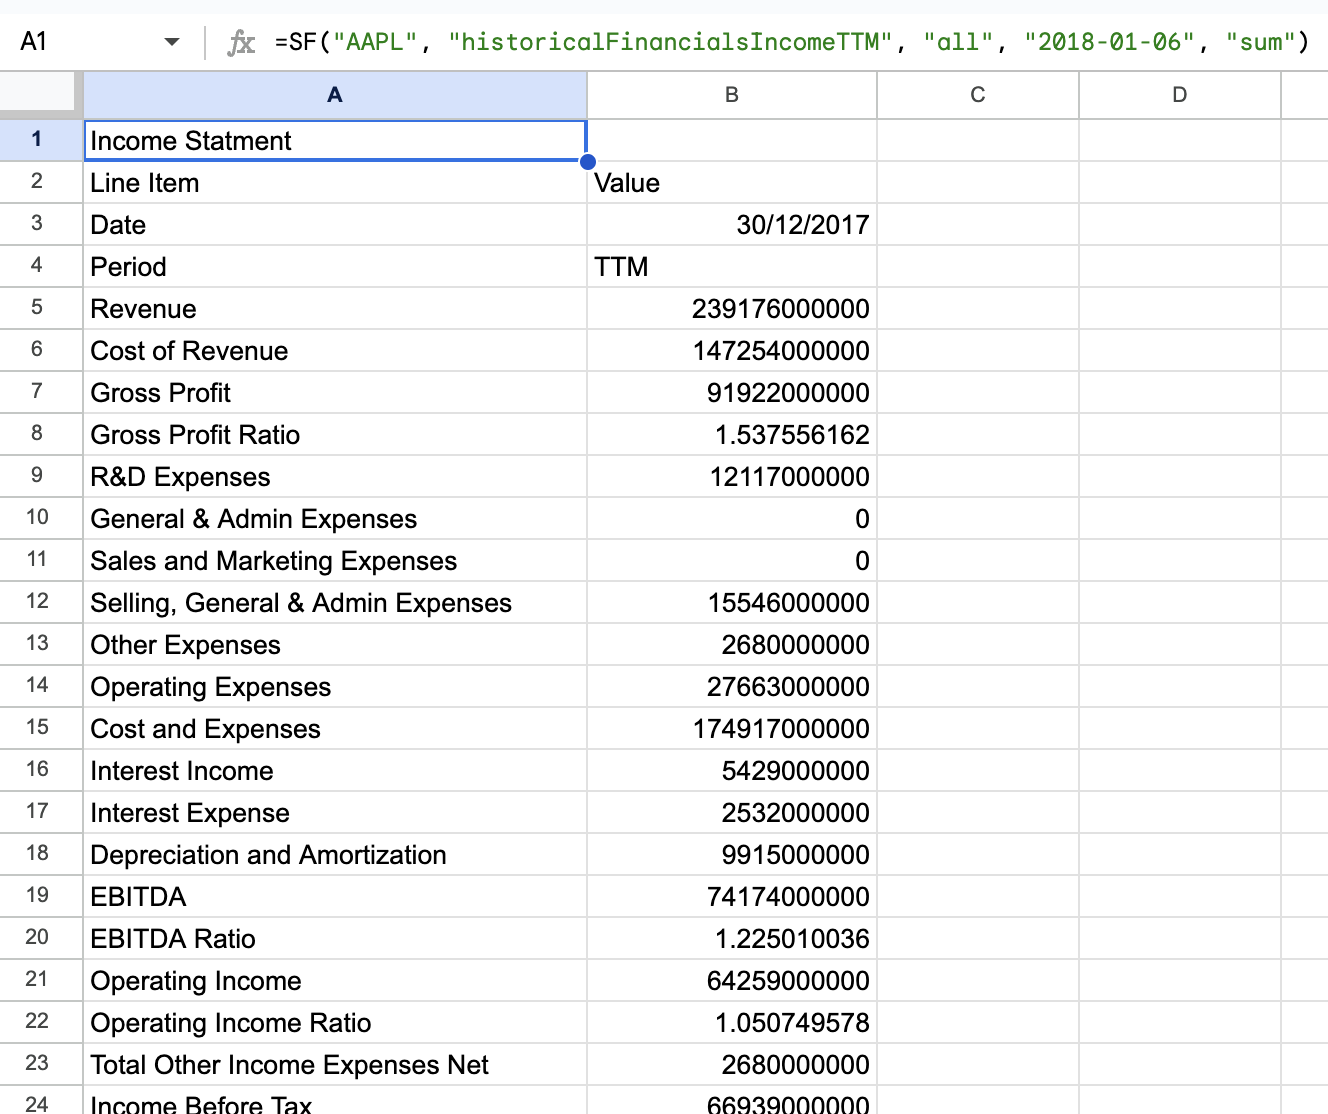
=SF("AAPL", "historicalFinancialsIncomeTTM", "all", "2018-01-06")

[multi-dimensional array]
Note: Notice that in this scenario "TTM" is appended to the end of the data type rather than written as the year parameter.
See the extended example below in Historical TTM.
Income Statement
A company's income statement can be access via the "historicalFinancialsIncome" data type for the annual report or with a quarter appended to the end for a specific quarter (e.g. "historicalFinancialsIncomeQ1" for Q1). There are 26 line items available. The following example shows you how you can use this data type to access Apple's EPS from 2010:
=SF("AAPL", "historicalFinancialsIncome", "eps", "2010")

0.550357
Note: The income statement is the only historical financial where you can set the year parameter to "ttm" to return the ttm data.
The Income Statement has the following line items available for the subtype:
All (
"all") - See The "all" OptionDate (
"date")Filing Date (
"filingDate")Reported Currency (
"reportedCurrency")Period (
"period")Revenue (
"revenue")Cost of Revenue (
"costOfRevenue")Gross Profit (
"grossProfit")Gross Profit Ratio (
"grossProfitRatio")R&D Expenses (
"researchAndDevelopmentExpenses")General & Admin Expenses (
"generalAndAdministrativeExpenses")Selling, General & Admin Expenses (
"sellingGeneralAndAdministrativeExpenses")Sales and Marketing Expenses (
""sellingAndMarketingExpenses")Other Expenses (
"otherExpenses")Operating Expenses (
"operatingExpenses")Cost and Expenses (
"costAndExpenses")Interest Income (
"interestIncome")Interest Expense (
"interestExpense")Depreciation and Amortization (
"depreciationAndAmortization")EBITDA (
"ebitda")EBITDA Ratio (
"ebitdaratio")Operating Income (
"operatingIncome")Operating Income Ratio (
"operatingIncomeRatio")Total Other Income Expenses Net (
"totalOtherIncomeExpensesNet")Income Before Tax (
"incomeBeforeTax")IncomeBeforeTaxRatio (
"incomeBeforeTaxRatio")Income Tax Expense (
"incomeTaxExpense")Net Income (
"netIncome")Net Income Ratio (
"netIncomeRatio")EPS (
"eps")EPS Diluted (
"epsdiluted")Weighted Average Shares (
"weightedAverageShsOut")Weighted Average Shares Diluted (
"weightedAverageShsOutDil")SEC URL Link (
"finalLink") (US stocks only)
Balance Sheet
A company's Balance Sheet Statement can be access via the "historicalFinancialsBalance" data type for the annual report or with a quarter appended to the end for a specific quarter (e.g. "historicalFinancialsBalanceQ2" for Q2). There are 37 line items available. The following example shows you how you can use this data type to access Apple's Cash in 2010:
=SF("AAPL", "historicalFinancialsBalance", "cashAndCashEquivalents", "2010")

11261000000
The Balance Sheet Statement has the following line items available for the subtype:
All (
"all") - See The "all" OptionDate (
"date")Filing Date (
"filingDate")Reported Currency (
"reportedCurrency")Period (
"period")Cash and Cash Equivalents (
"cashAndCashEquivalents")Short Term Investments (
"shortTermInvestments")Cash and Short Term Investments (
"cashAndShortTermInvestments")Net Receivables (
"netReceivables")Inventory (
"inventory")Other Current Assets (
"otherCurrentAssets")Total Current Assets (
"totalCurrentAssets")PP&E (
"propertyPlantEquipmentNet")Goodwill (
"goodwill")Intangible Assets (
"intangibleAssets")Goodwill and Intangible Assets (
"goodwillAndIntangibleAssets")Long-term Investments (
"longTermInvestments")Tax Assets (
"taxAssets")Other Non-current Assets (
"otherNonCurrentAssets")Total Non-current Assets (
"totalNonCurrentAssets")Other Assets (
"otherAssets")Total Assets (
"totalAssets")Accounts Payable (
"accountPayables")Short-term Debt (
"shortTermDebt")Tax Payables (
"taxPayables")Deferred Revenue (
"deferredRevenue")Other Current Liabilities (
"otherCurrentLiabilities")Total Current Liabilities (
"totalCurrentLiabilities")Long-term Debt (
"longTermDebt")Deferred Revenue Non-current (
"deferredRevenueNonCurrent")Deferred Tax Liabilities Non-current (
"deferredTaxLiabilitiesNonCurrent")Other Non-current Liabilities (
"otherNonCurrentLiabilities")Total Non-current Liabilities (
"totalNonCurrentLiabilities")Other Liabilities (
"otherLiabilities")Capital Lease Obligations (
"capitalLeaseObligations")Total Liabilities (
"totalLiabilities")Common Stock (
"commonStock")Preferred Stock (
"preferredStock")Retained Earnings (
"retainedEarnings")Accumulated Other Comprehensive Loss (
"accumulatedOtherComprehensiveIncomeLoss")Other Total Stockholder Equity (
"othertotalStockholdersEquity")Total Stockholder Equity (
"totalStockholdersEquity")Total Equity (
"totalEquity)Total Liabilities and Stockholder Equity (
"totalLiabilitiesAndStockholdersEquity")Minority Interest (
"minorityInterest")Total Liabilites and Total Equity (
"totalLiabilitiesAndTotalEquity")Total Investments (
"totalInvestments")Total Debt (
"totalDebt")Net Debt (
"netDebt")SEC URL Link (
"finalLink") (US stocks only)
Cash Flow
A company's Cash Flow Statement can be access via the "historicalFinancialsCash" data type for the annual report or with a quarter appended to the end for a specific quarter (e.g. "historicalFinancialsCashQ3" for Q3). There are 31 line items available. The following example shows you how you can use this data type to access Apple's Operating Cash Flow in 2010:
=SF("AAPL", "historicalFinancialsCash", "operatingCashFlow", "2010")

18595000000
The Cash Flow Statement has the following line items available for the subtype:
All (
"all") - See The "all" OptionDate (
"date")Filing Date (
"filingDate")Reported Currency (
"reportedCurrency")Period (
"period")Net Income (
"netIncome")Depreciation and Amortization (
"depreciationAndAmortization")Deferred Income Tax (
"deferredIncomeTax")Stock Based Compensation (
"stockBasedCompensation")Change in Working Capital (
"changeInWorkingCapital")Accounts Receivables (
"accountsReceivables")Inventory (
"inventory")Accounts Payables (
"accountsPayables")Other Working Capital (
"otherWorkingCapital")Other Non-Cash Items (
"otherNonCashItems")Net Cash Provided by Operating Activities (
"netCashProvidedByOperatingActivities")Investments in PP&E (
"investmentsInPropertyPlantAndEquipment")Acquisitions Net (
"acquisitionsNet")Purchases of Investments (
"purchasesOfInvestments")Sales Maturities of Investments (
"salesMaturitiesOfInvestments")Other Investing Activites (
"otherInvestingActivites")Net Cash Used for Investing Activites (
"netCashUsedForInvestingActivites")Debt Repayment (
"debtRepayment")Common Stock Issued (
"commonStockIssued")Common Stock Repurchased (
"commonStockRepurchased")Dividends Paid (
"dividendsPaid")Other Financing Activites (
"otherFinancingActivites")Net Cash Used Provided by Financing Activities (
"netCashUsedProvidedByFinancingActivities")Effect of FOREX on Changes in Cash (
"effectOfForexChangesOnCash")Net Change in Cash (
"netChangeInCash")Cash at End of Period (
"cashAtEndOfPeriod")Cash at Beginning of Period (
"cashAtBeginningOfPeriod")Operating Cashflow (
"operatingCashFlow")Capital Expenditure (
"capitalExpenditure")Free Cashflow (
"freeCashFlow")SEC URL Link (
"finalLink") (US stocks only)
The "all" Option
You can select All in the function generator or directly choose it as a subtype ("all") in your function for any of the historical financial statements:
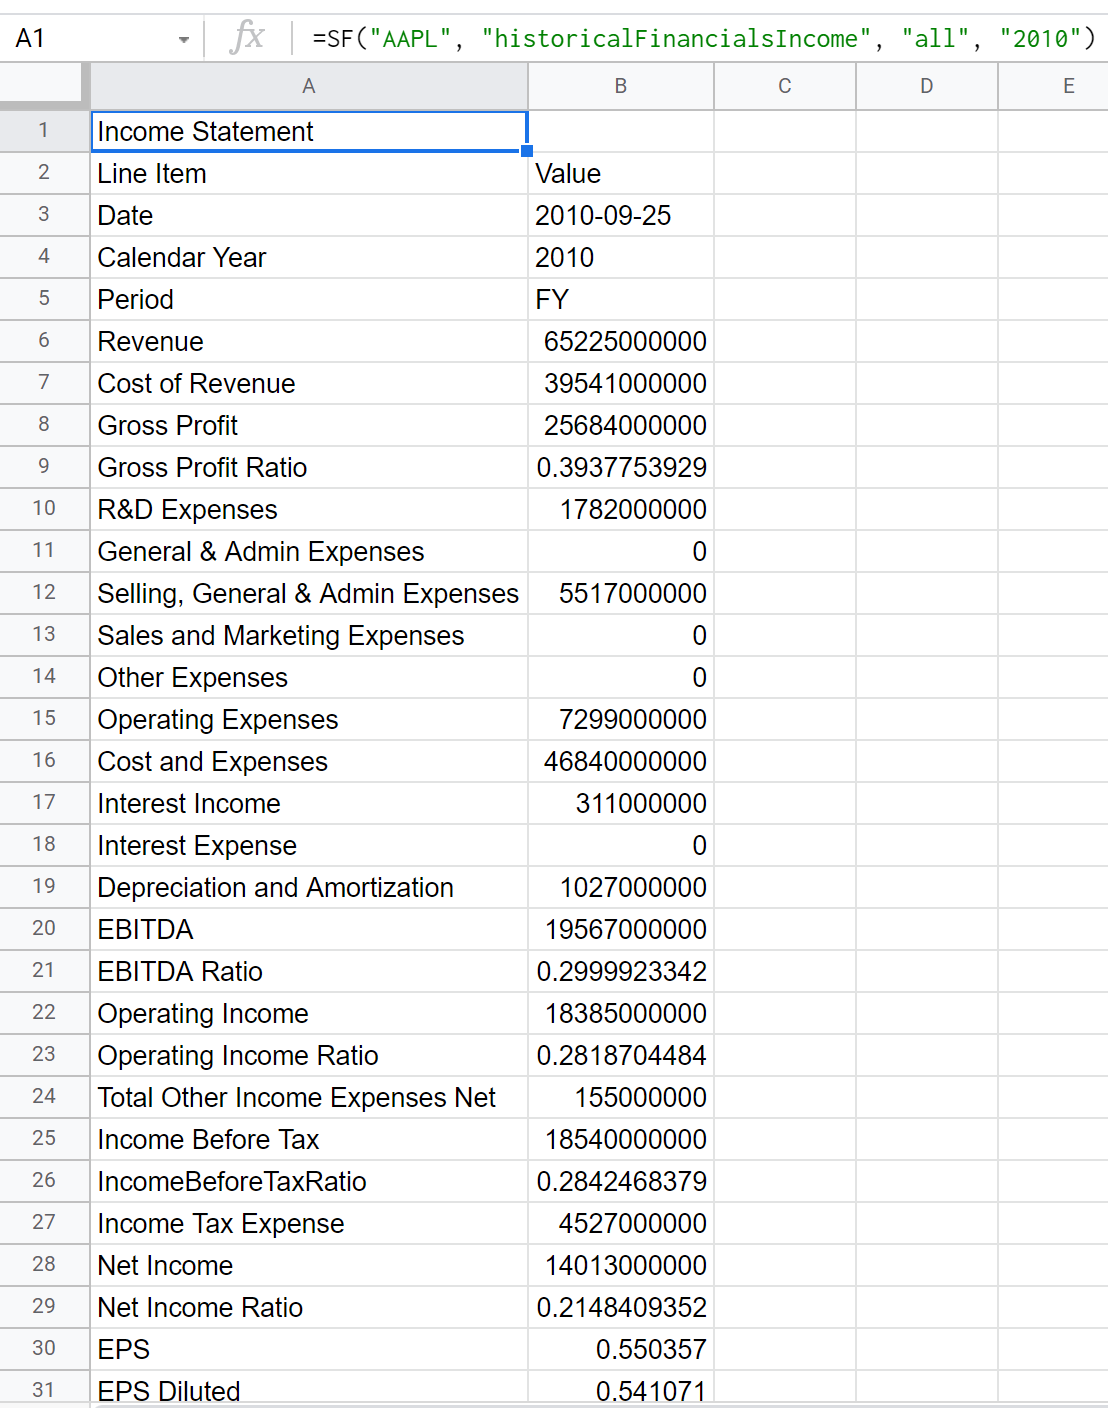
=SF("AAPL", "historicalFinancialsIncome", "all", "2010")Important: This will not execute if the any of the cells to be filled by the resulting array already have content
This will return the entire financial statement for the selected year. For example the output of the above function is:
Multiple Years
Potentially one of the most powerful SheetsFinance functions is our multiple years statement dump allowing you instant access to 30+ years of financial statements side-by-side with one function.
Multiple Years Annual
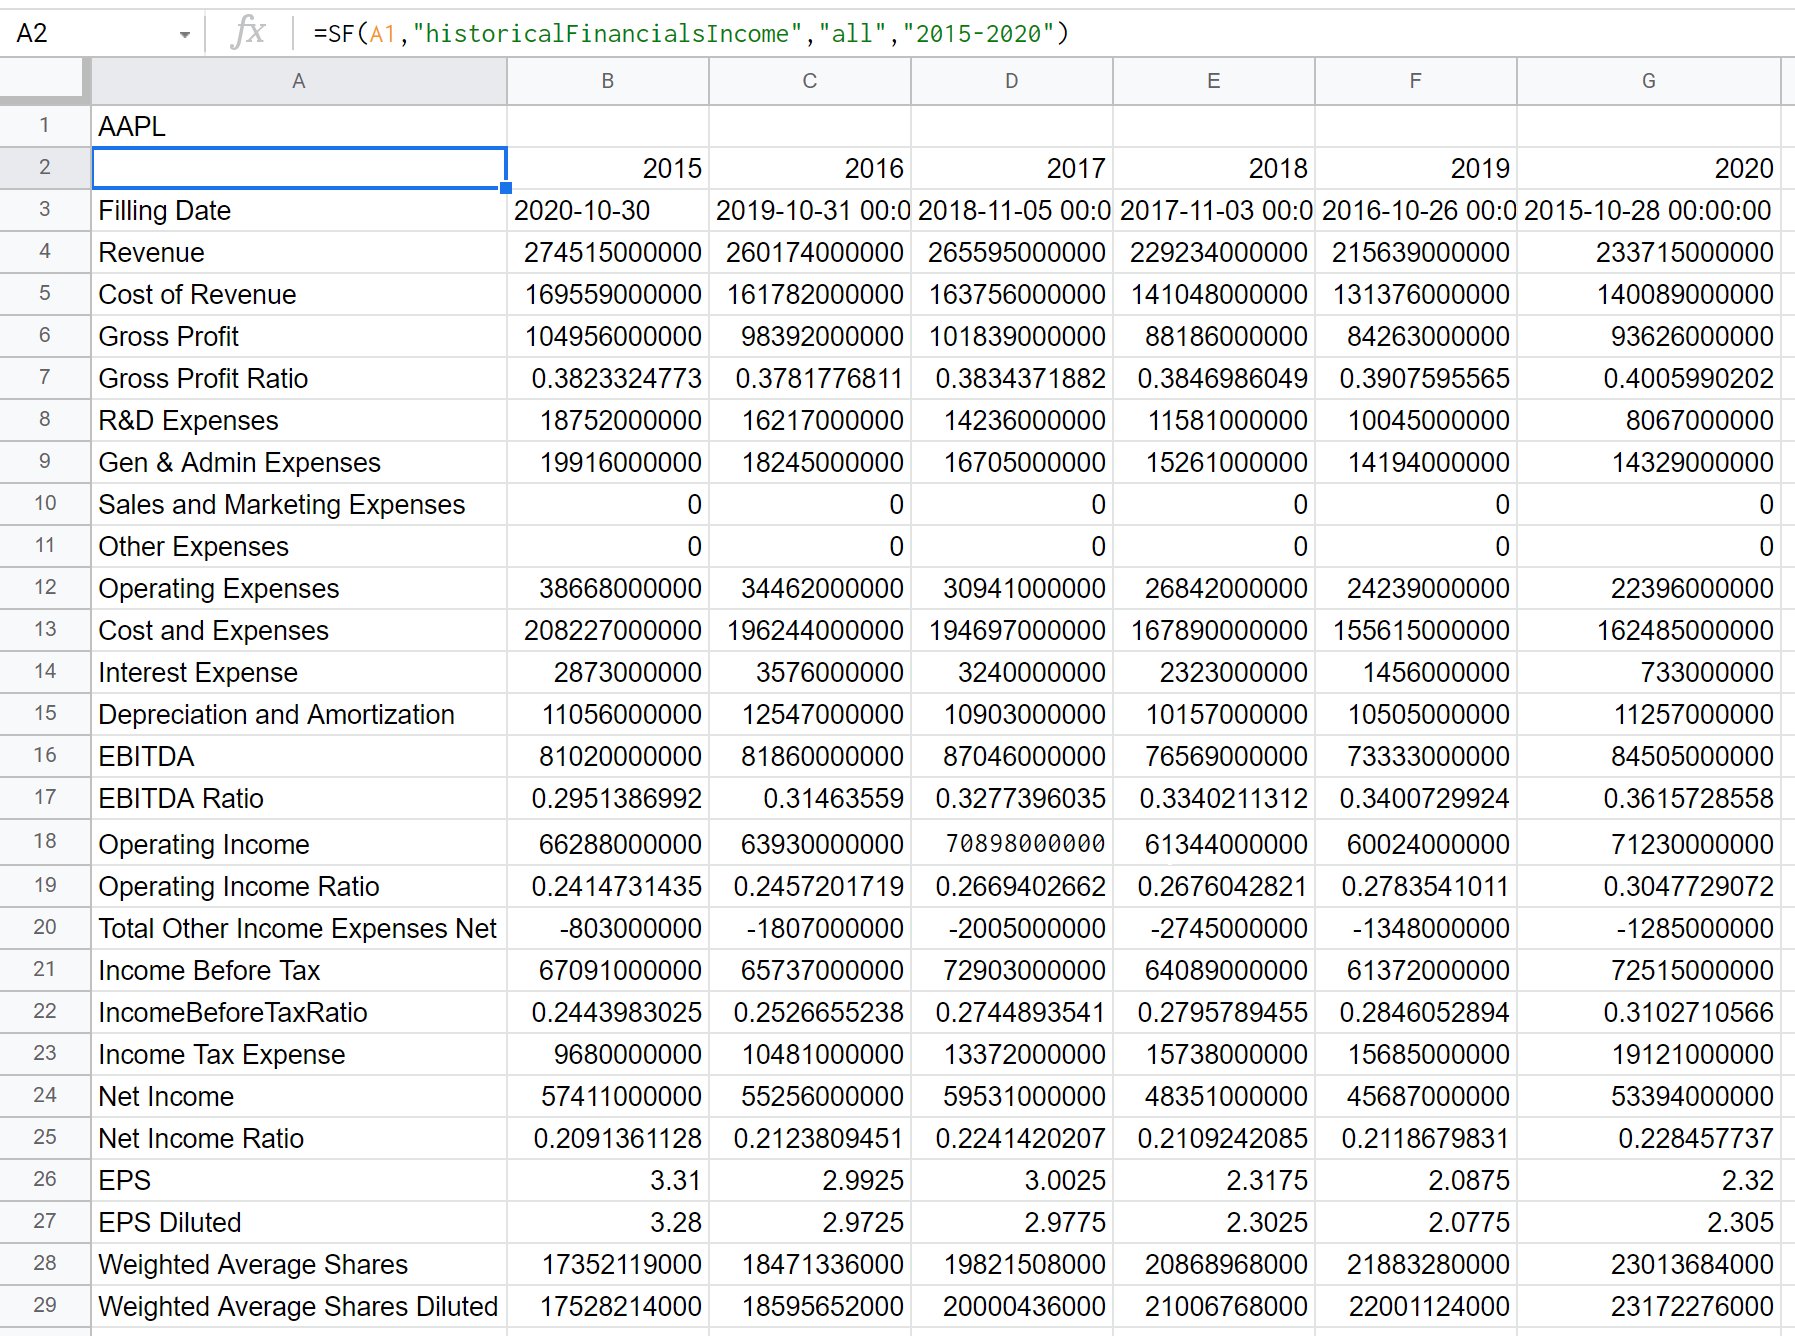
You can generate multiple years of annual statements simply:
=SF("AAPL", "historicalFinancialsIncome", "all", "2015-2020")This will return the entire range of years side-by-side so you can easily track change of line items over time.
Multiple Years Quarterly
In exactly the same fashion as above for annual statements, you can generate multi-year quaterly statement dumps like so:
=SF("AAPL", "historicalFinancialsIncomeQ", "all", "2010-2023")Notice here that the data type ends with Q, this denotes all quarters from 2015-2020 which outputs like so:
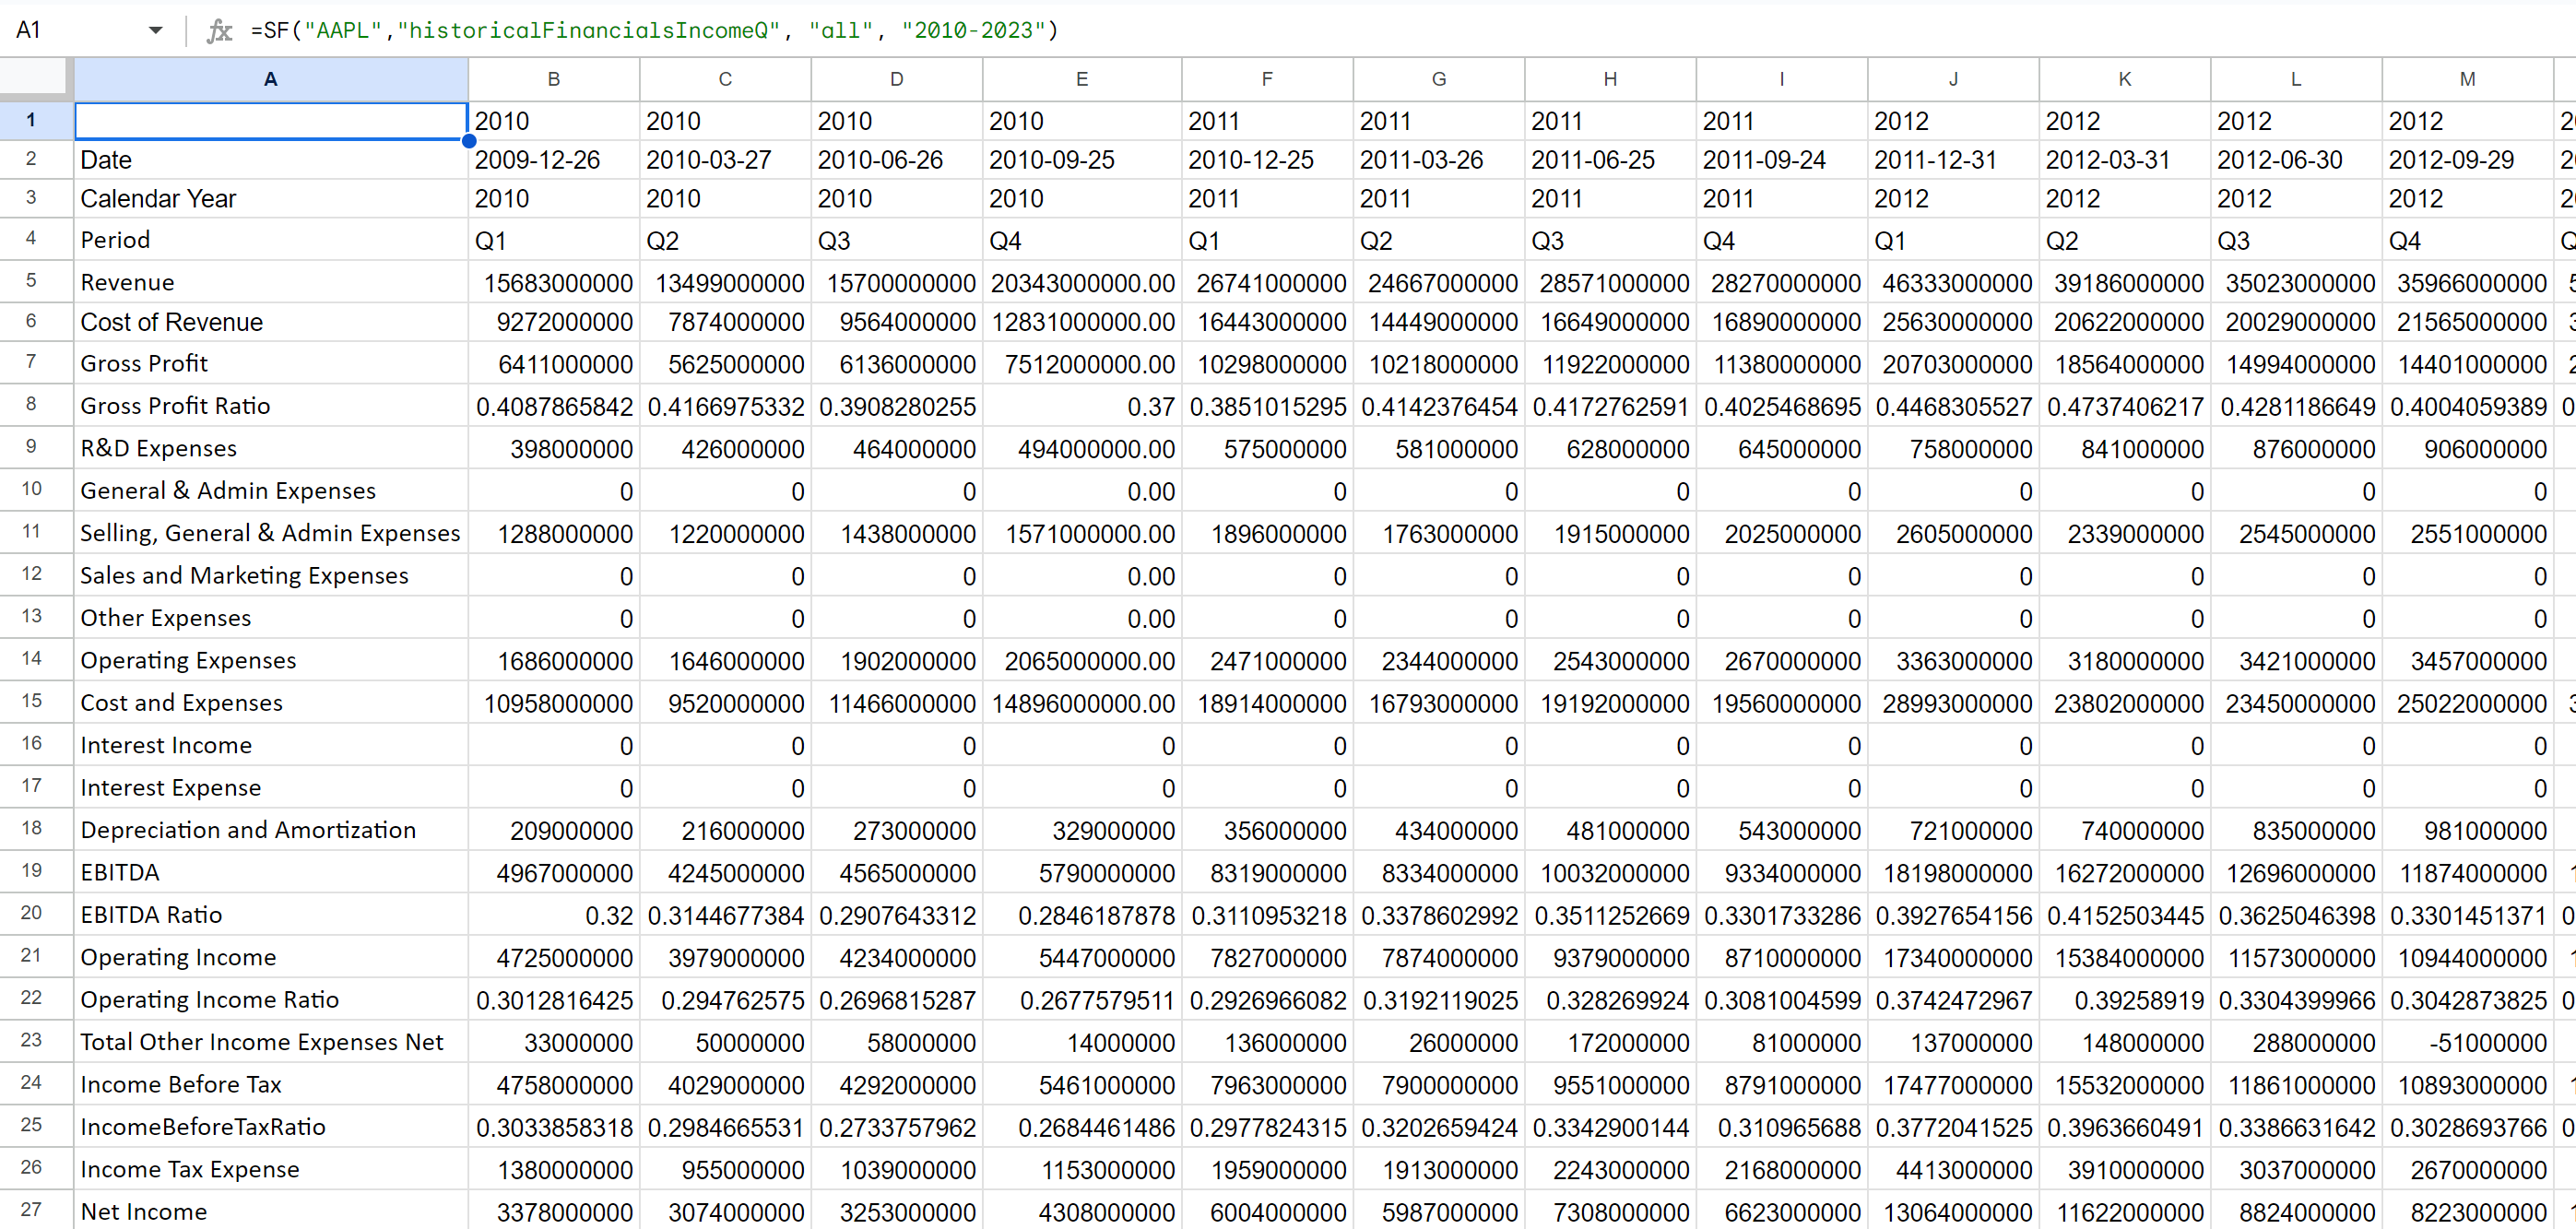
You can also specify a specific quarter to display (e.g. Q1) over multiple years. This allows you to compare that specific quarter year-on-year like so:
=SF("AAPL", "historicalFinancialsIncomeQ1", "all", "2010-2023")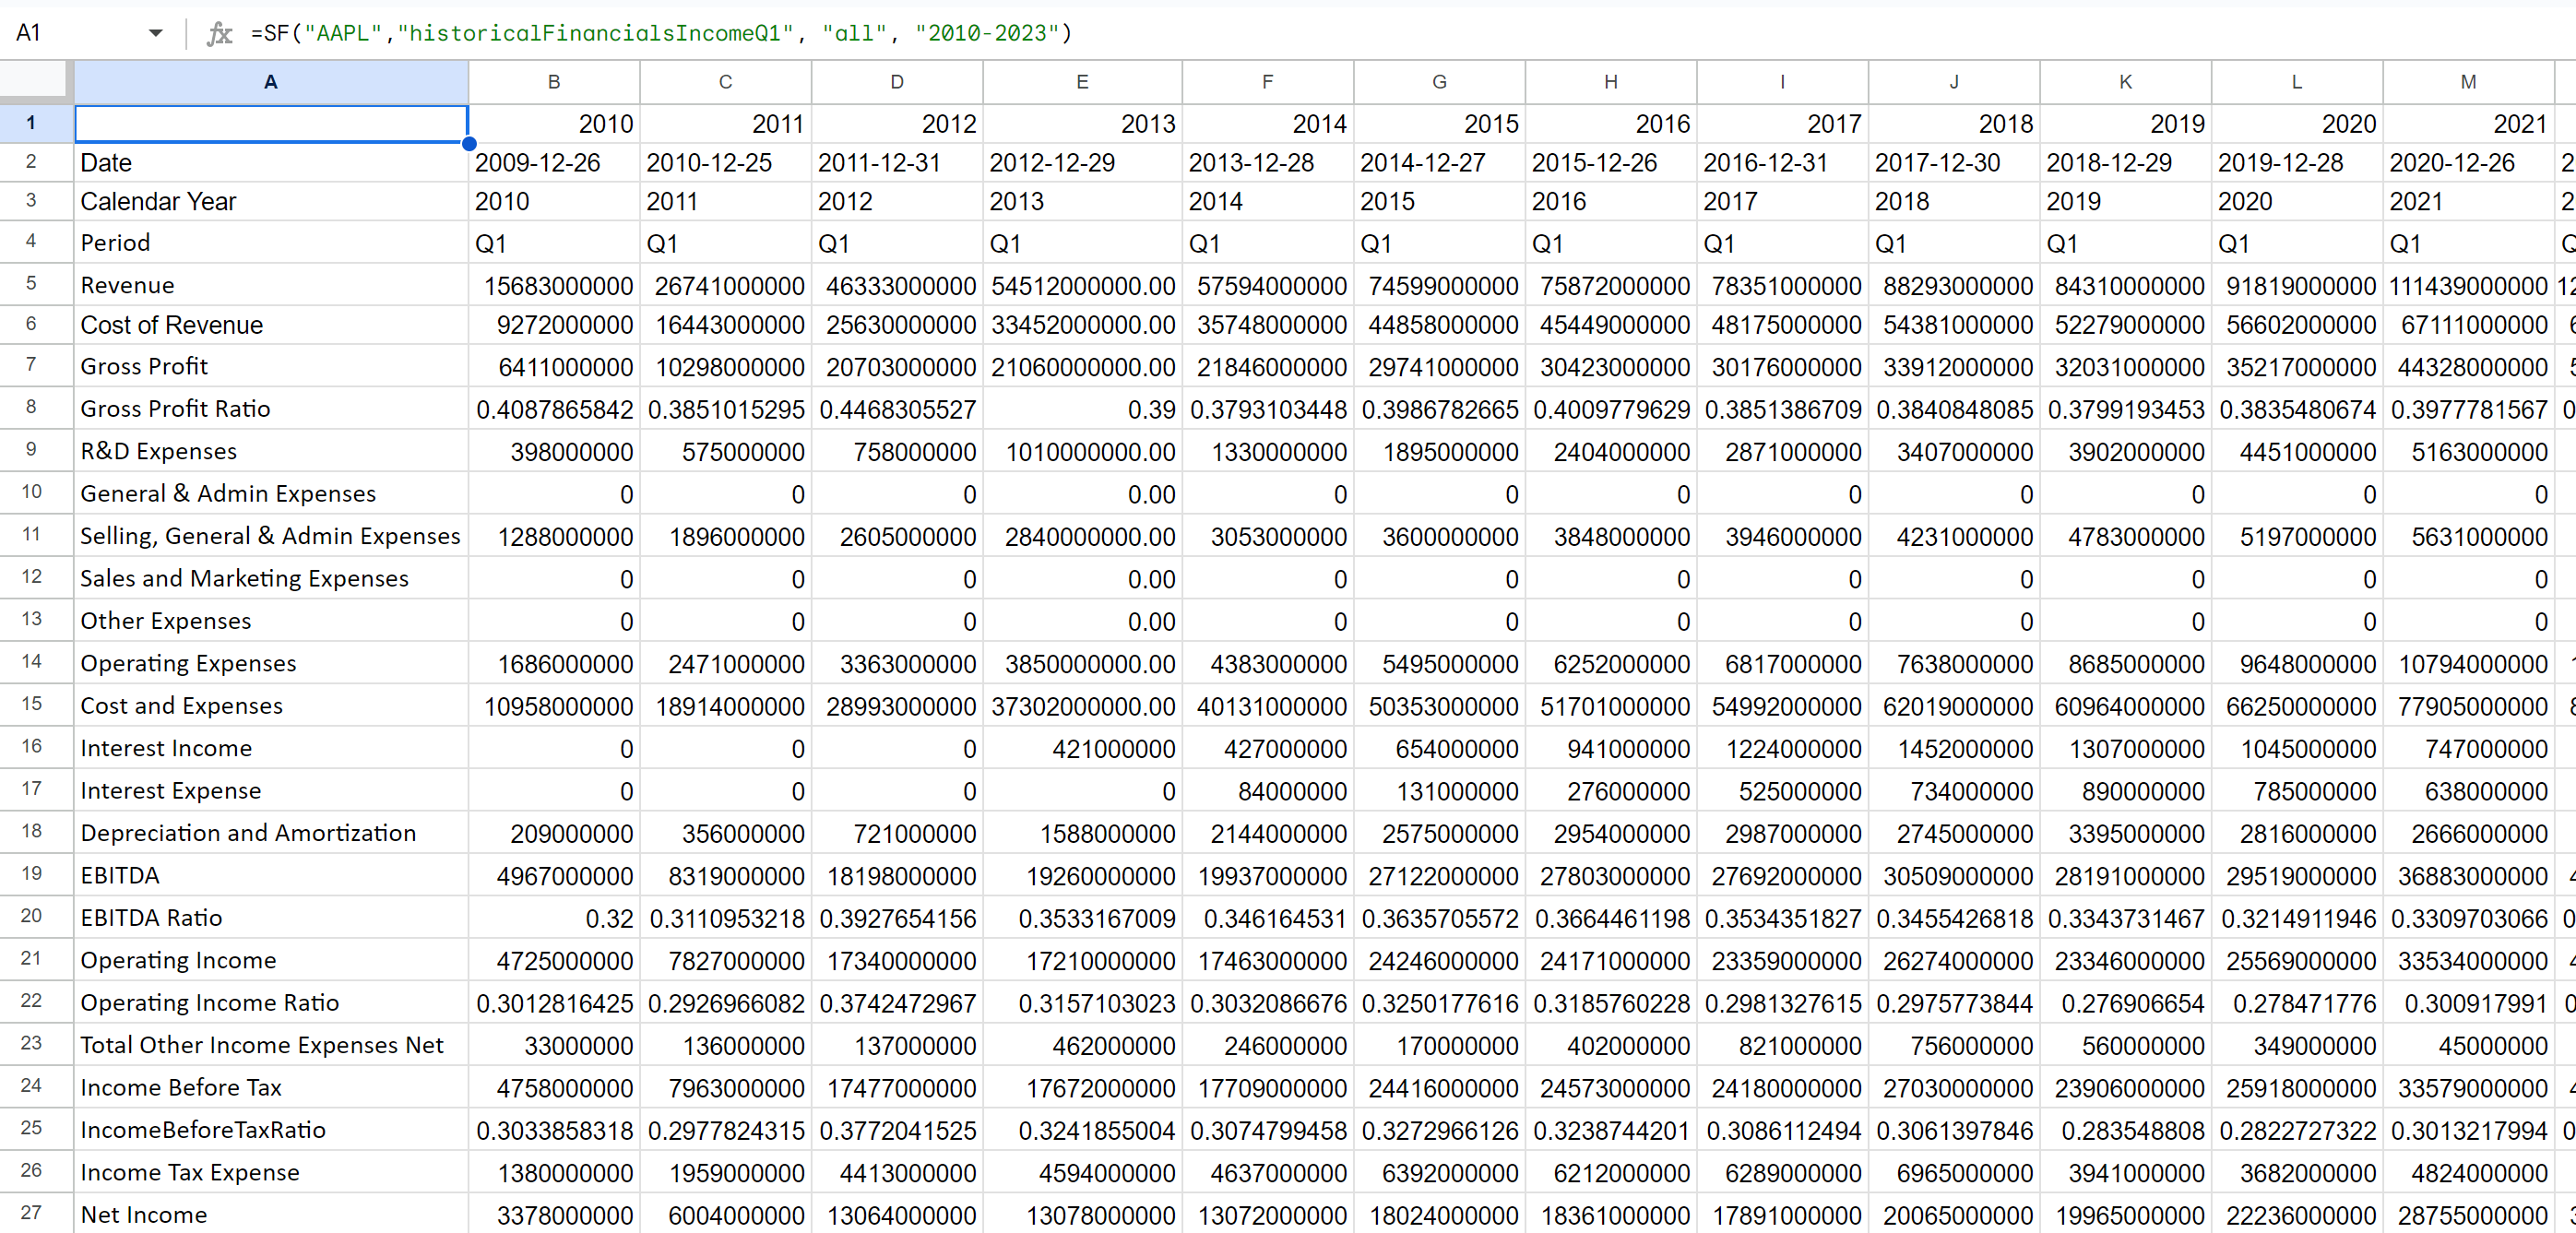
You can apply all the same metric filtering to multi-year quarterly statements as you would any of our historical financial functions.
Historical TTM
By appending TTM to the end of the financial statement you're after you can generate a historical TTM report. This shows the 4 quarterly reports (or last 12 months) of financial results from the date you specify in the formula like so:
=SF("AAPL", "historicalFinancialsIncomeTTM", "all", "2018-01-06")Note: Notice that in this scenario "TTM" is appended to the end of the data type rather than written as the year parameter.
As you can see in the below result, you are now instantly viewing the last 12 months of quarterly reporting for Apple Inc. from the date 6 January 2018.
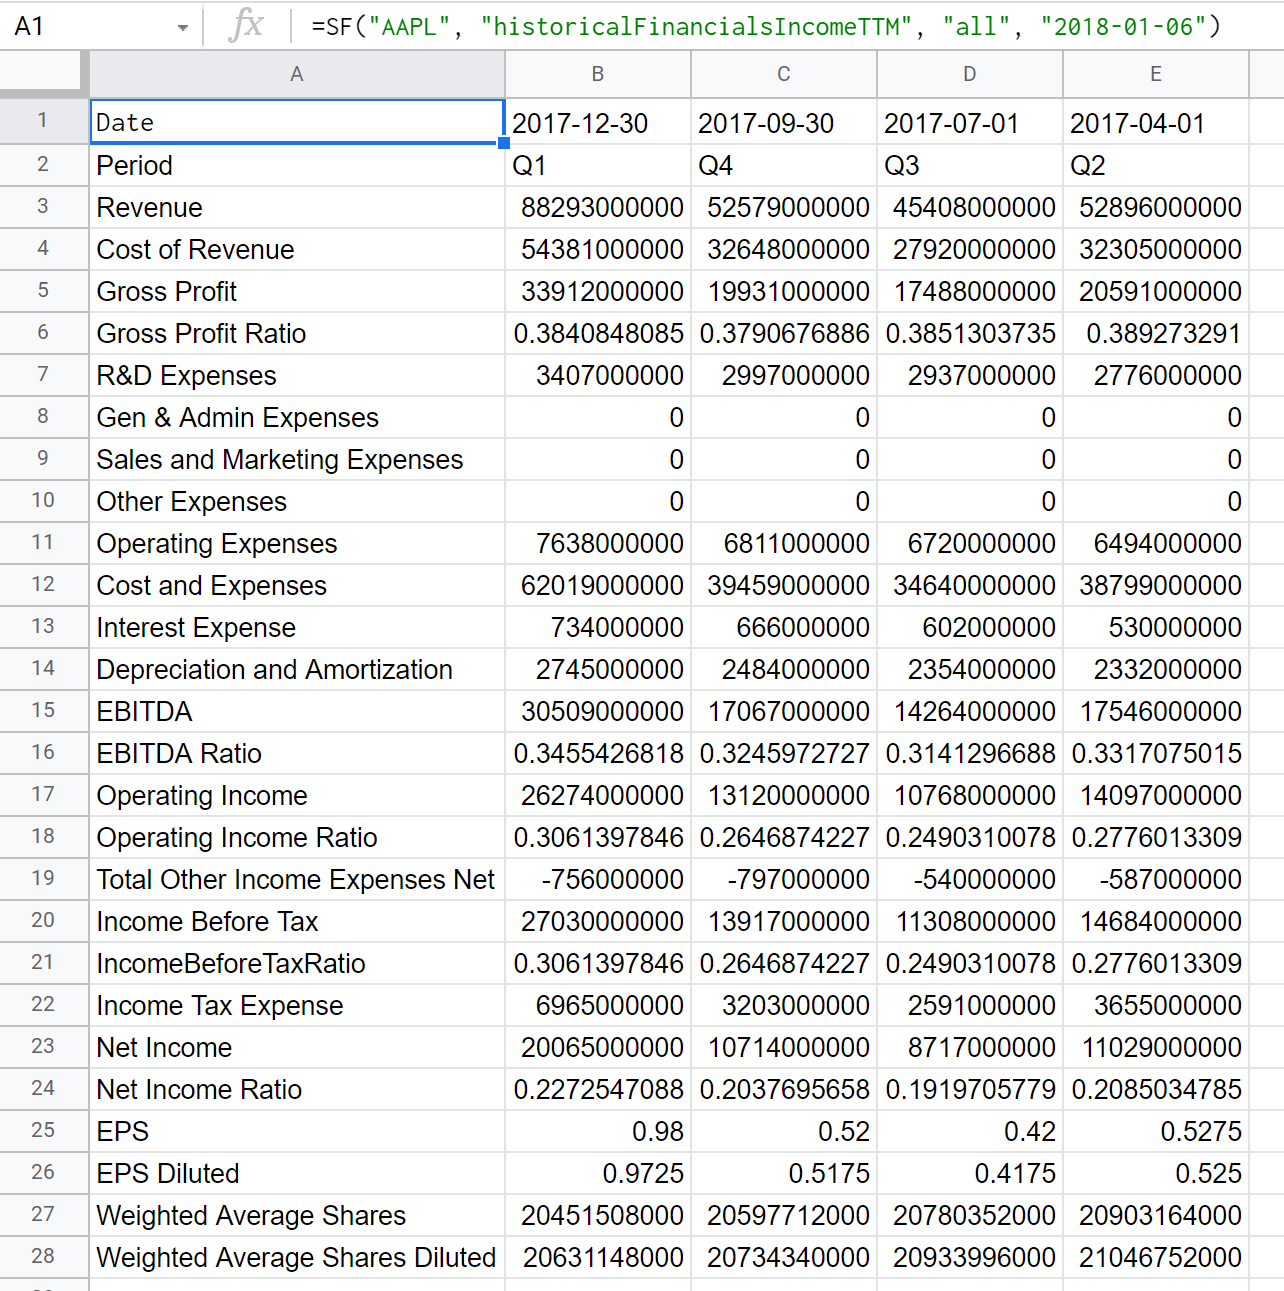
You can also use the "sum" option to return the summed TTM value from any date in history. This is useful for comparing the TTM value at a specific date historically like so:
=SF("AAPL", "historicalFinancialsIncomeTTM", "all", "2018-01-06", "sum")